Threading Performance and agents_per_block#
The threading model spreads work across a worker pool by handing
each thread whole memory blocks of agents to step. Because
a block is the unit of work, the number of blocks is a hard ceiling on how many
threads can be busy at once. This applies to every agent type in POLARIS —
travellers, vehicles, links, controllers, or any other Execution_Object.
The knob that controls this is agents_per_block (set per agent type via
Average_Execution_Objects_Hint). It determines how many blocks a given number of
agents is split into:
num_blocks ≈ num_agents / agents_per_block
If num_blocks is smaller than the number of worker threads, some threads will
have nothing to do and the extra parallelism is wasted.
The figures below come from the BirthsAndDeaths performance harness in
apps/births_and_deaths/, which is a minimal illustration of this behaviour: each
agent is a “person” that, on every iteration, randomly reproduces or dies. It is
deliberately trivial per-agent work, so the runtime is dominated by the engine’s
per-block scheduling and the threading behaviour is easy to see. The same
principles govern any real agent workload. All runs use 1,000,000 agents.
Figures are regenerated with apps/births_and_deaths/generate_plots.py after
running the harness.
Threads vs simulate time#
When blocks are well-sized (a few hundred to a few thousand agents each) there are plenty of blocks to go around, so simulate time scales cleanly with thread count.

The agents_per_block cliff#
Oversized blocks starve threads of work. With agents_per_block=200000 there are
only 5 blocks, and with agents_per_block=500000 only 2. The 500000 curve
flattens almost immediately: past two threads there is no more work to
parallelise, so adding threads does nothing.

Normalising each configuration to its own single-thread time makes the ceiling
explicit. The small-block configurations track the ideal linear speedup line
reasonably well, while 500000 never exceeds roughly 1.6x regardless of thread
count.

Visualising core_diag.json#
Every run writes a core_diag.json summary (see Core Diagnostics for the
full set of diagnostic files and how to produce them). It records, per worker
thread, how long it spent doing useful work (step_ms) versus waiting at the thread
gates for other threads to finish (wait_ms); wait_pct is the idle fraction and
total_wait_pct aggregates it across the pool. A one-line version is also logged at
the end of the run:
[NOTICE] Threading efficiency: 93.3% utilisation (6.7% wait) across 8 threads
To make the block-granularity effect concrete, the same workload was run across 8 threads twice:
balanced —
agents_per_block=1000(1000 blocks): plenty of work to spread across 8 threads.blocky —
agents_per_block=500000(2 blocks): only 2 threads can ever be busy.
Per-thread step vs wait time#
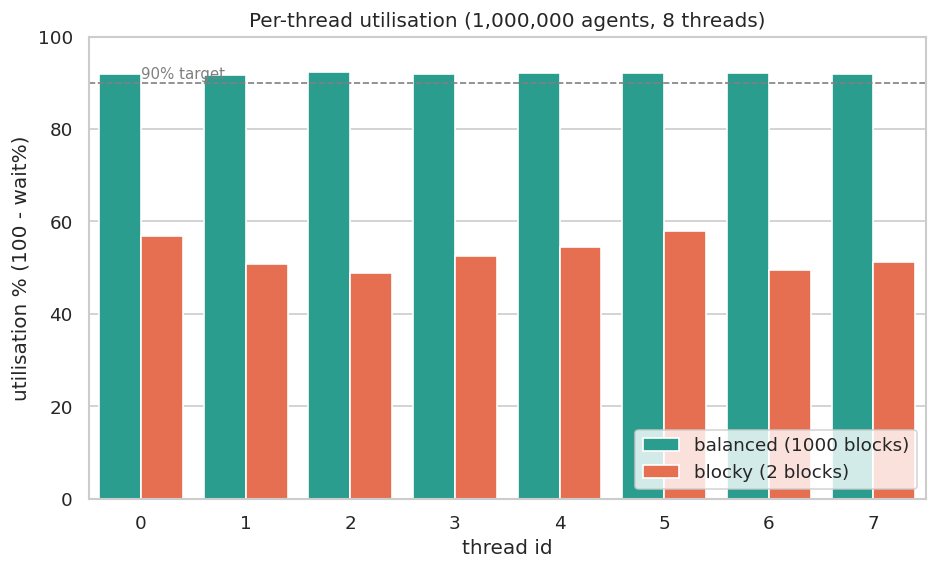
In the balanced run every thread is almost entirely working (~8% wait). In the blocky run all 8 threads report ~45–50% wait: gate synchronisation forces every thread to wait for the slowest block each iteration, so the whole pool is throttled to the pace of the 2 busy workers.

Threading efficiency#
Utilisation (100 - wait_pct) is the single number to watch when tuning
agents_per_block. A healthy configuration keeps every thread above ~90%
utilisation; when the block count drops below the thread count, utilisation
collapses and the extra threads are wasted.
Takeaways#
Keep
agents_per_blocksmall enough thatnum_agents / agents_per_blockis comfortably larger than the thread count you intend to run.core_diag.json’stotal_wait_pct(and per-threadwait_pct) is the quickest way to spot a block-granularity bottleneck: high wait % with plenty of agents usually means too few blocks.