8. Transit & Active#

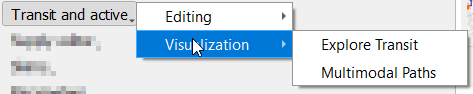
Transit and active menu has two main components (shown in the menu to the right):
Editing
Visualization

8.1. Editing#
Transit editing tools in QPolaris include GTFS import, creation of active transport (bike and walk) networks and direct Public Transport (PT) editing of stops, routes and patterns.
8.1.1. Public Transport Editing#

The PT editor can be opened from the Transit editing menu. It provides two tabs:
Stops editor
Routes/Patterns editor
8.1.1.1. Stops editor#
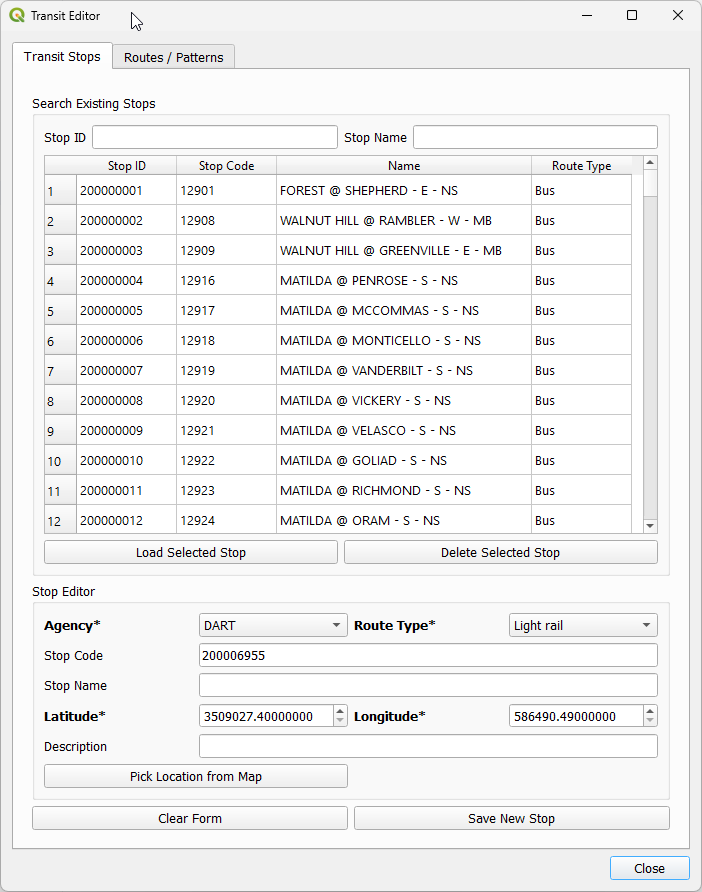
The Stops editor allows users to create, inspect and delete stops.
The upper section provides filters for existing stops by ID and name, plus buttons to load a stop into the form or delete it.
The lower form allows setting agency, route type, stop code, stop name, location and description for a new or updated stop.
8.1.1.1.1. Picking stop location from map#

To set coordinates directly from the map:
Click Pick Location from Map
Click the desired location on the map canvas
Confirm that longitude and latitude fields are populated
8.1.1.1.2. Saving and deleting stops#

After filling required fields (agency, route type and coordinates), click Save New Stop to add the stop to the model supply.

Deleting a stop requires selecting it in the table and confirming the action in the confirmation dialog.
8.1.1.2. Routes and patterns editor#
The Routes/Patterns editor is used to create routes, inspect existing patterns, build pattern stop sequences and create trips.
Selecting a route filters the map to that route, its patterns and associated stops. Selecting a pattern further filters the map to the selected pattern and its stops.
In Pattern Builder mode, users can click stops directly on the map to build a new sequence. Existing stops already used by the selected route patterns are shown with stronger visual emphasis to support faster pattern editing.
8.1.2. GTFS Import#

The main screen for GTFS import in the Polaris plugin includes the list of feeds already configured, a option to recreate the walk network after importing the transit feeds and three options to deal with existing transit tables: Keeping everything, deleting the data and purging all the tables, which results in dropping all tables and re-creating them according to the network standard that has shipped with the plugin. Choosing not to re-create active transport networks will result in all the new transit stops to be DISCONNECTED FROM THE REST OF THE NETWORK until the re-building of the active transport networks, and it is therefore discouraged.
To add feeds (no upper limit in the number of feeds you can add), the user can press the button Add Feed and use the file selection screen that will open to select the GTFS feed of choice as a zip file.

After selecting the feed, the calendar widget in the next screen will limit the choice of day for import according to the information available in the feed itself, and the day of choice is usually a Tuesday or Thursday, but the user is free to pick any day in the available range. Also note that entering text for the agency’s name and a description for it is mandatory.

In the following two tabs the user has the opportunity to choose the default route capacities per route type (see the GTFS specification for the correspondence between route types and physical modes), as well as to choose if a new table with raw transit route shapes (if available in the feed) should also be created alongside the Polaris transit tables.

8.1.3. Creating Active transport networks#

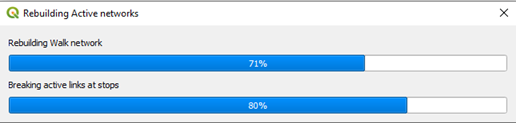
Selecting this option will show a menu with a button to start the process of creation of walk/bike networks. After pressing the button, it will IMMEDIATELY CLEAR TRANSIT_WALK AND TRANSIT_BIKE TABLES prior to rebuilding it (showing the progress bar below), so let it run through the end if you have pressed it by mistake.
8.2. Visualization#
There are two visualization tools for transit data in QPolaris, one for the Transit services themselves and one for multimodal routing.
8.2.1. Multimodal router#
The multimodal router tool in QPolaris has a few less resources than its traffic router, and that’s mostly due to the fact that there is a lot more information to show for the paths between any two locations in the network.
There are basically 4 controls needed to compute a multimodal route, as shown in the GUI on the right. The first one is the time of day one wants to compute a route for, followed by the origin and destination locations for the route, and finally the list of modes one wants to compute a route for, which includes Bus, Rail, Cycle, Walk, Park & Ride, Park & Rail, TNC and Ride and Micromobility.

When computing routes between an origin and a destination, the solution for each selected mode will be presented in a different layer (if found) and with a different marker style (squares, triangles, circles, etc). The multiple modes used in each route are represented using different colors, with Walk being green, bike being blue, transit in yellow and traffic links (i.e. TNC, P&R) in red.
Origin and destination for the route are also shown, with a circle in red for the origin and in black for the destination, as shown below.

8.2.2. Transit Services navigator#
The Polaris transit route system is particularly difficult to analyze, as they are composed by many tables, which are connected by a somewhat complicated series of foreign keys in the supply file.
In order to facilitate the display and analysis of transit systems, the Polaris QGIS Plugin has a transit navigator menu that allows for convenient exploration of the transit data in your Supply and Demand databases.
The menu triggers the layers for transit routes, patterns and stops to be loaded, and populates the screen above with independent lists for all three components for the transit system.

Navigating the many transit elements (Routes, Patterns and Stops) can be done in two different ways.
The first way is to type into any of the boxes in the top of the screen, which filters the data in the corresponding box immediately below it, and the second is to click on any element of any of the tree lists.
Regardless of the method chosen, filtering/selecting elements from one box will trigger the filtering of the other elements to correspond to the selection made.
For example, clicking on a route will select all the patterns available for that route and all the stops covered in any of those patterns, while clicking on a stop will trigger a selection of all patterns (and routes) that make use of that stop.
Pressing the MINOR RESET button clears any selection.
8.2.2.1. Global Filtering#

The interface also allows the user to use some global filters to select the data (supply and demand) of their interest.
The filters available are:
Transit Agency
GTFS type
Time window (to the nearest minute)
Direction (All, South/West or North/South)
Besides filtering, the user can also set the sampling used in the model to scale their results to the universe (applied to demand metrics only).
If shapes were available during GTFS import, the option for loading them alongside the model data will also be available. This data holds no bearing on Polaris functionalities, but it is useful in verifying the quality of the Map-matching results provided by the GTFS import, as raw shapes are only shown when a single Pattern is selected.
Once you have set global filters, the minor reset button rests the tables to those global filters, while the RESET button eliminates the global filters and resets the state of the table to the entire dataset.
8.2.2.2. Mapping#
The Transit Navigator is capable of mapping supply and demand statistics, summarized at zone, route/pattern and stop levels.
All mapping methods allow for the selection of labels to be shown and, in the relevant cases, for a scale bar to control the map appearance, as that can aid in highlighting the metrics of interest, as shown below.

Filtering the data, in general, updates the map results to match the filtered network, but it is recommended that the map is refreshed with the Map! buttons before producing maps that will underpin any substantive analysis.
It is important to note that demand-related metrics will be available only if a demand database has been opened along the supply database.
8.2.2.2.1. Stops#
The supply metrics available at stop level are:
routes
patterns
trips
seated_capacity
design_capacity
total_capacity’
The demand metrics available at stop level are:
alightings
pax_hour_for_alighted
pax_km_for_alighted
boardings
pax_hour_for_boarded
pax_km_for_boarded
Mapping at stop level can be done with thematic maps based on color ramps and by changing the diameter (or thickness) of points/stops.
8.2.2.2.2. Routes and Patterns#
The supply metrics available at route and pattern levels are:
trips
seated_capacity
design_capacity
total_capacity
The demand metrics available at route and pattern levels are:
total_boardings
maximum_load
most_boardings_trip
most_crowded_trip
As it was the case for the case for mapping at stop level, mapping at route and pattern levels can be done with thematic maps based on color ramps and by changing the width (or thickness) of lines.
8.2.2.2.3. Zones#
Mapping transit data to zones is only available for demand data, and includes both absolute measures and as rates on population and employment.
The metrics available are the following:
alightings boardings
alightings_per_1000_pop
boardings_per_1000_pop
alightings_per_1000_jobs
boardings_per_1000_jobs
pax_hour_for_alighted
pax_km_for_alighted
pax_hour_for_boarded
pax_km_for_boarded
Mapping zones can be done as thematic maps for a range of color scales, with pie charts or stacked bar charts.
8.2.2.3. Scenario comparison#
The Transit navigator also supports comparison transit supply and demand between two scenarios. For that to happen, the user can load an additional supply and demand files and choose whether they want absolute or relative differences.

After adding a scenario for comparison, all map results will be for the comparison (whether with absolute or relative differences) between the two scenarios loaded.
8.2.2.4. Video tutorial#
Video recorded on Mar/07/2023
8.3. Styling#
No styles for visualizing transit data are available at the moment