13. Systems Management Support#
Note
The systems management support tools are only available when on the Argonne network. This menu will not be available if the plugin cannot establish a connection to internal ANL servers.
There are two different tools available for systems management support in the QPolaris plugin: One for update on the status of model runs being executed through the EQ-SQL system in any of the high-performance computers available.
The second tool allows users to analyse past model performance from the database of virtually all model runs executed within the ANL network in the recent past.
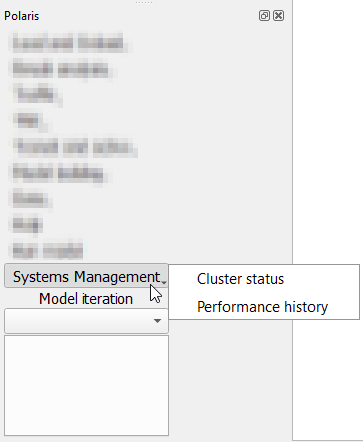
13.1. Cluster status#
This menu item allows users to view the clusters available for use and task-specific status. Detailed information for each high-performance computer connected to the cluster control and tasks running, completed, or waitlisted can be seen. On clicking the menu action button for ‘Cluster Status’, the user is prompted with a screen that shows the available computers for use and additional meta data.
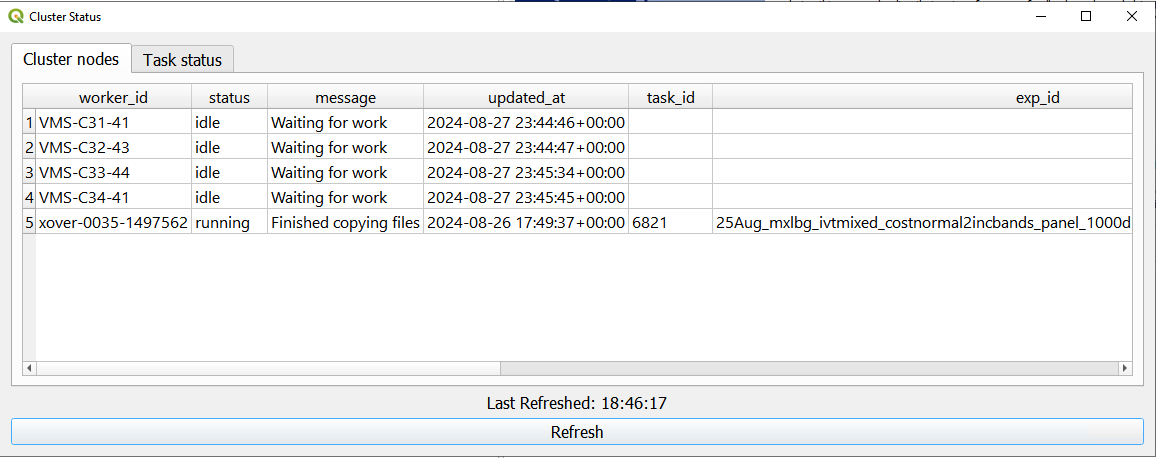
Double-clicking on nodes with valid task IDs will switch the task status screen with all available information on that task.
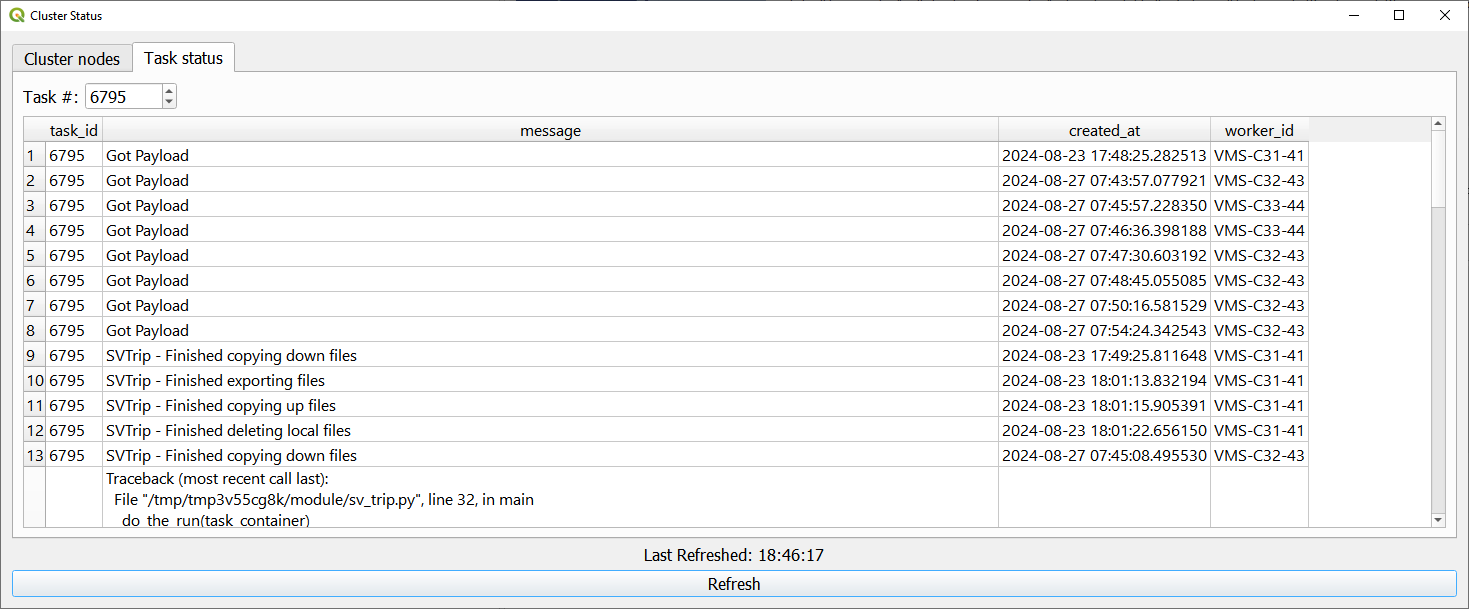
Task status can also be retrieved for any non-active task by typing their their ID in the spinbox above the task status table.
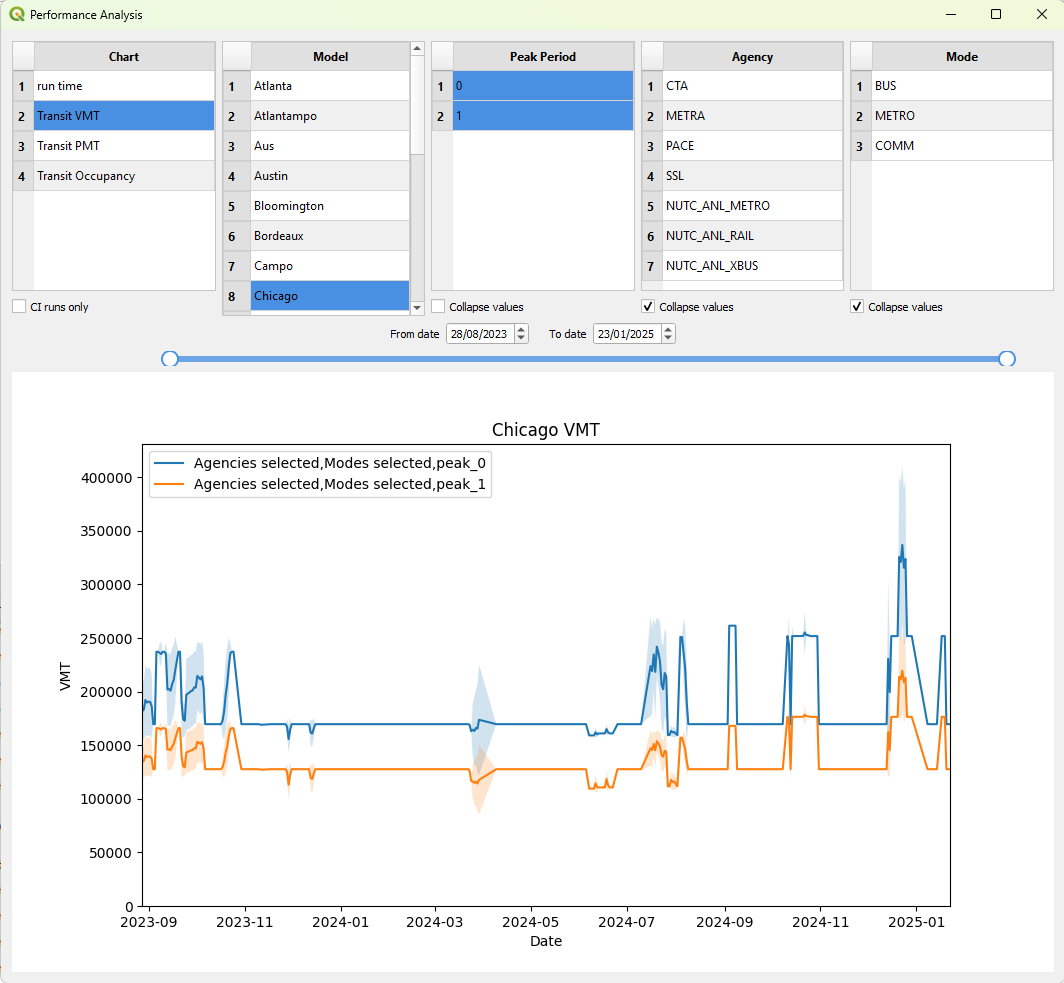
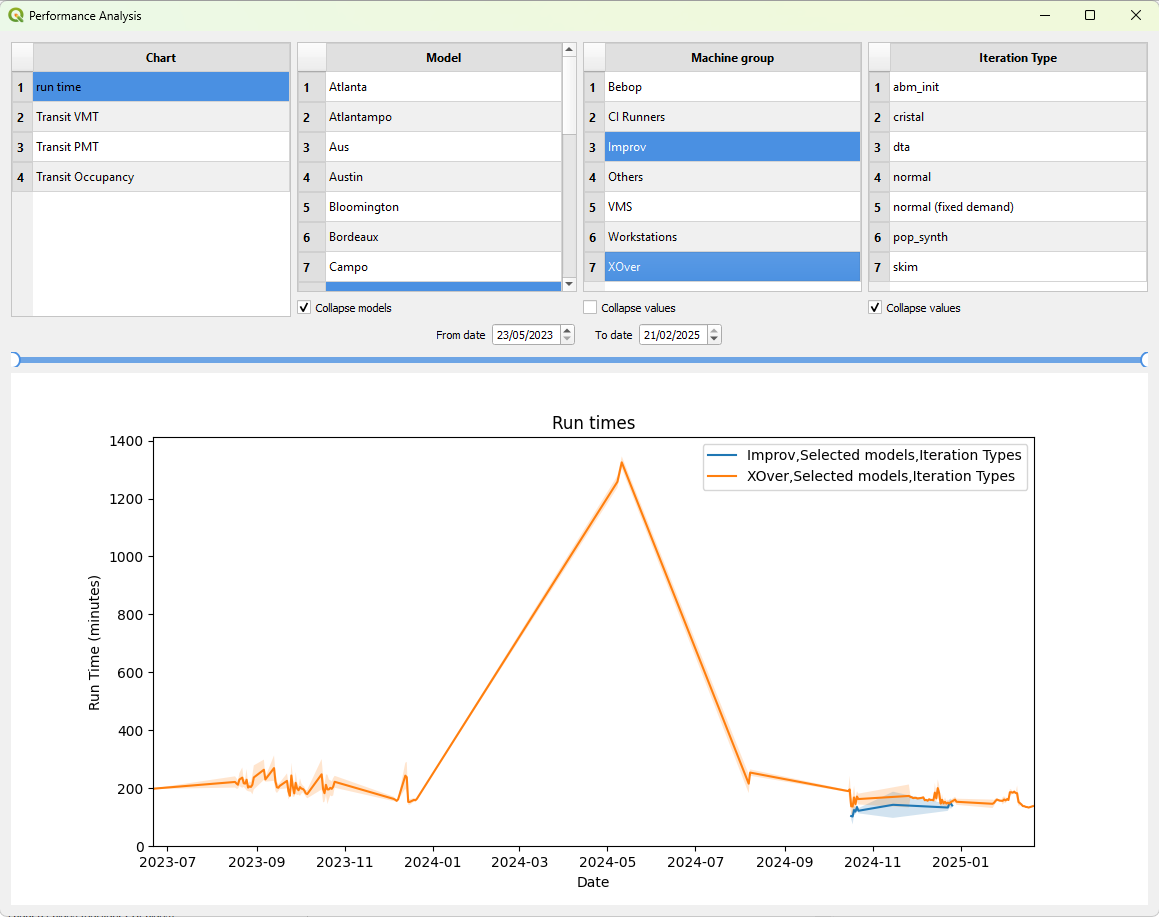
13.2. Performance History#
This menu gives the user access to tool that allows the user to plot a series of historic metrics for made as far back as August/2023, and plotting period can be selected down to individual days through the dropdown boxes or the sliding bar. Currently, model run times and public transport-related metrics can be plotted, but other charts will be added in the future
The run time gistory chart allows the user to filter the results by model, machine group (e.g. VMS, Improv, Bebop, etc.) and iteration type (e.g. abm_init, normal, cristal, etc.). All variables selected can also be presented collapsed into a single line or as individual lines. A simple example is shown in the map below.
Transit metrics (VMT, PMT and Occupancy) can be plotted for a single model at a time, and the user can filter to specific peak periods, agencies and modes. As it was the case with the run time charts, transit metrics can also be plotted with a single line that incorporates all selected variables, or detailed across any particular variable. The user can also select to display only model runs made by the CI system, which may provide a better window into the changes made to Polaris and the models themselves, as it does not include model runs made for scenario analysis during individual studies. An example of these charts is shown below.