4. Traffic#
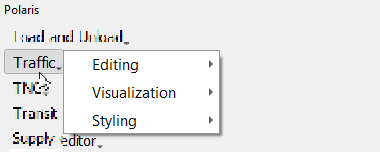
The traffic menu has tree main components (shown in the menu to the right):
Editing
Visualization
Styling
4.1. Editing#
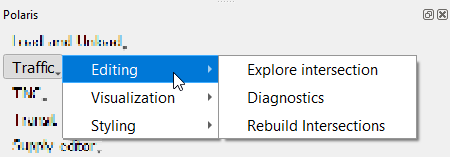
There are three separate tools for editing traffic data in the Polaris Supply file
4.1.1. Exploring and Editing Intersections#
Selecting the option to explore intersections has the same effect as clicking
on the  icon in the Polaris ToolBar.
The mouse cursor will change shapes and you will be able to click on a node for which you would like to show the connections and signal information for, as shown below.
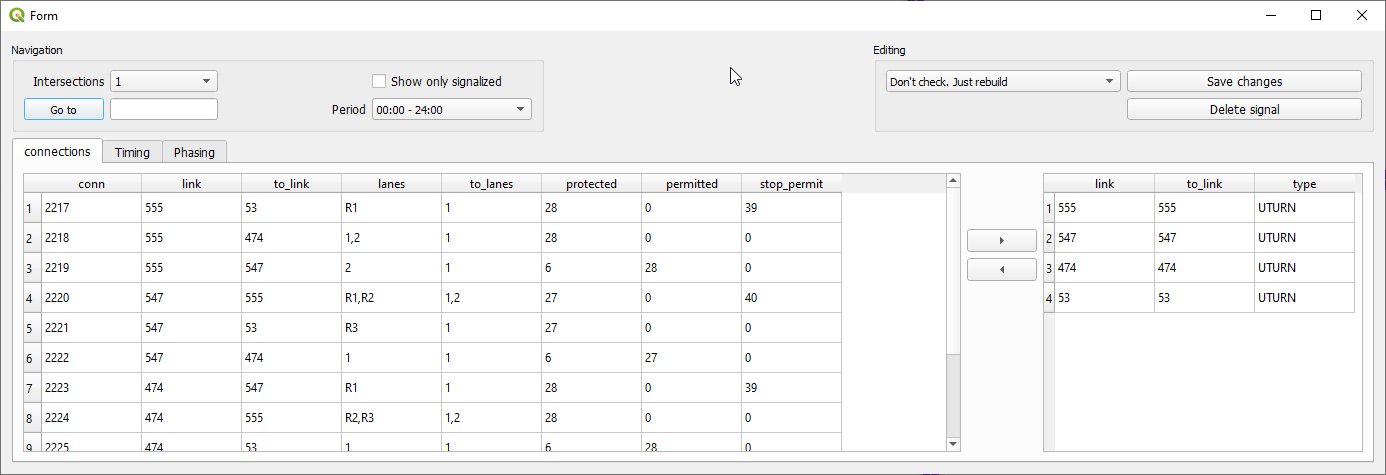
This first screen allows you to see all the connections available for that node and the connections not currently available, allowing you also to remove existing connections or adding others at will.
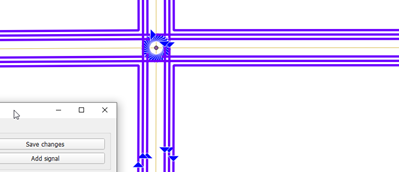
While the data can be seen on the GUI, on the map all the connections will be rendered any time a new node is selected, and selecting one or more connections on the screen will select said connections on the map and hide the others.
The second and third tabs on the intersection GUI are only available on intersections with traffic signal control, and the timing screen has no editing purposes, but displays all timings for all phases on that particular signal control.
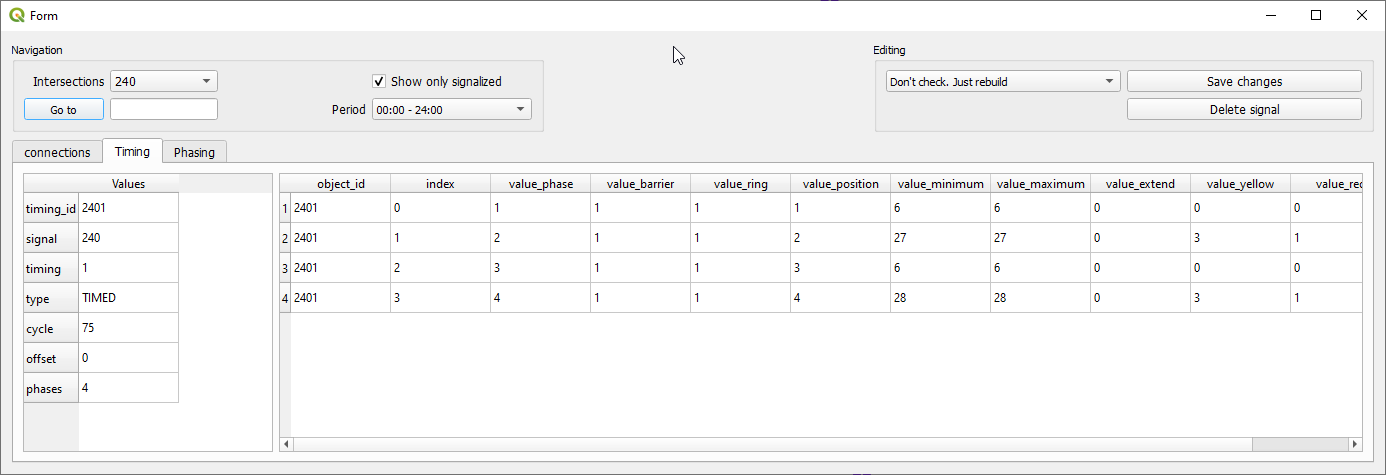
The third and last screen allows the user to see each phase independently, and by selecting them on the left side panel, all movements in that phase will be rendered according to its priority (i.e. protected, permitted and stop permit).
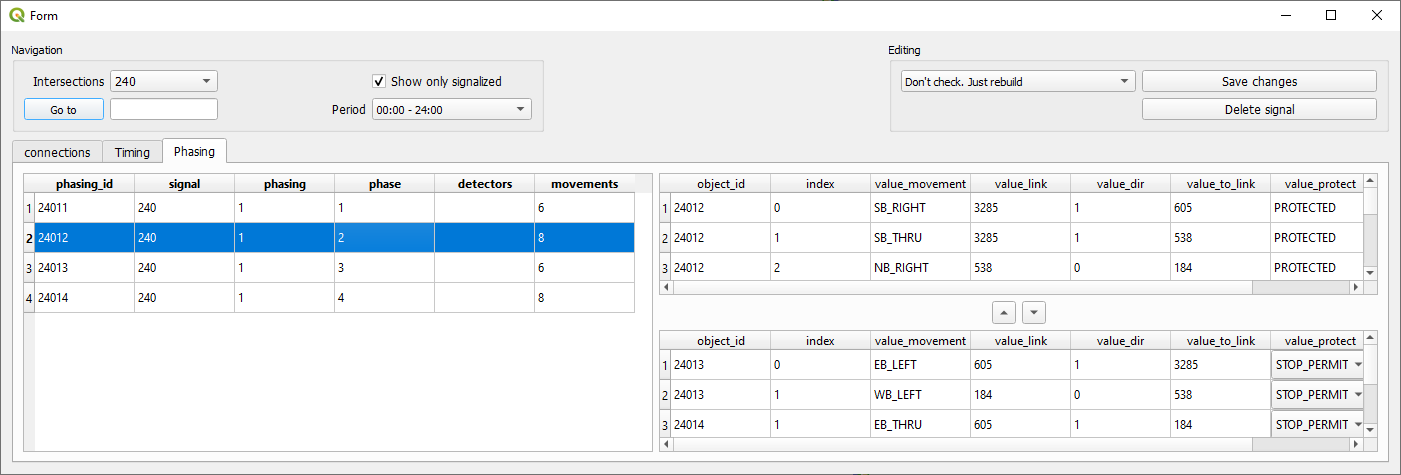
The user can also add and remove movements from each phase, but the results are not checked for feasibility and may result in a crash in Polaris.
4.1.2. Network diagnostics#
The network diagnostics tool is designed to find short network links and detours that are known to cause bottlenecks during Polaris traffic simulations.
The first tool loads all short links into a table, according to the parameter provided by the user, and clicking in each link zooms the map canvas to the chosen link.
If the user decides to eliminate the short link, it will be deleted and the nodes that are part of their extremities will be merged.
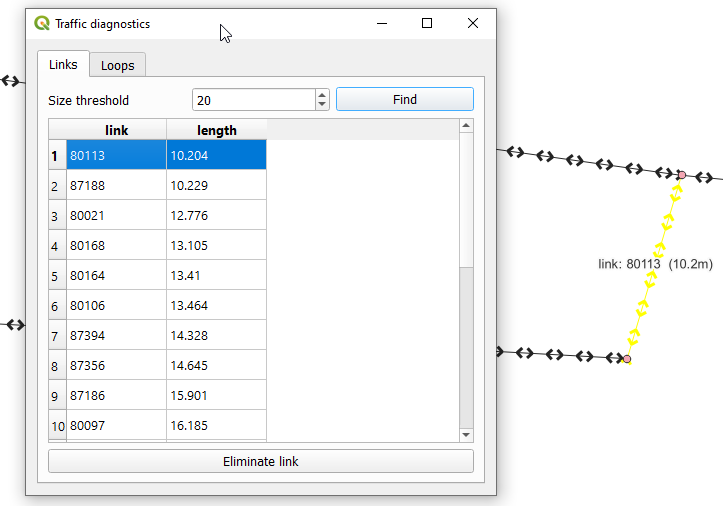
Detecting detours in networks is a more time-consuming process, as it relies on path finding from NetworkX (a package that is widely known to be slow) and analysis of the connections table (NetworkX does not support turn restrictions).
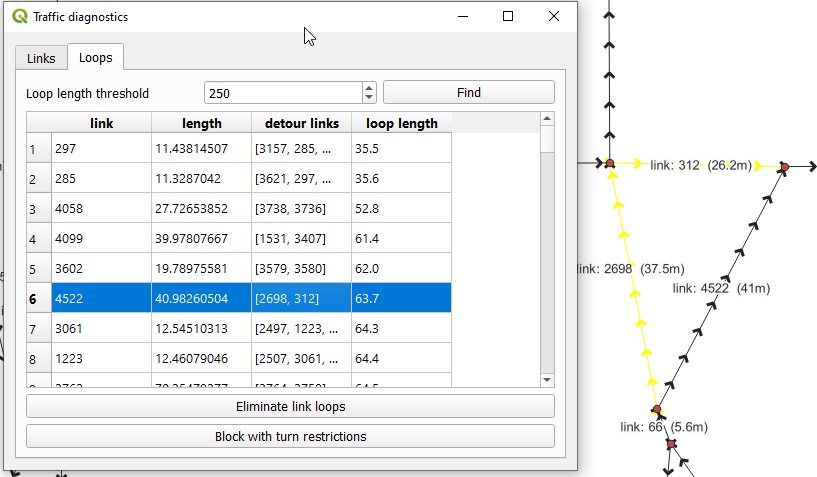
Eliminating detours is also more complex when it comes to eliminating them, as one can simply eliminate all links that are part of the loop and essentially merge it as a node, or it can be done by adding a turn restriction between the two links that are part of the detour. Buttons for both options are available on the interface.
A video demonstration of this tool can be found in the video below, which also includes a demonstration of the network checker.
4.1.3. Rebuilding all Intersections#
The connections table contains all possible movements at a connection down to the lane level, and a movement between two links can only exist if a record for such movement exists in that table. For this reason, any node in the network, even if connecting only two adjacent links, is considered a “intersection”.
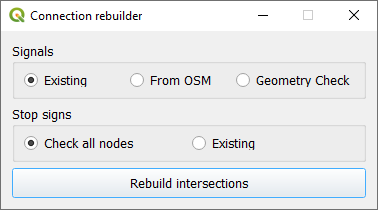
Besides the connections table, the Polaris supply file also contains tables with specifications for signal control and stop sign priorities, and all these tables are re-built when use the intersection rebuilding tool.
The standard options when rebuilding intersections are to keep signalized intersection for the nodes which currently have such control, and to analyze all other nodes for the need of stop signs, which is done based on simple rules based on road hierarchy.
It is also possible to re-generate signals using a geometric check, which tends to generate more signals than those that exist in practice, or to use Open-Street Maps as a source of data to determine where do signals exist.
Stopping this tool while it is running might result in loss of data, particularly the indication of which nodes have signalized intersection, so it is recommended that you back it up before starting.
4.2. Visualization#
The visualization menu gives access to one tool, which is the batch router for computation of paths over the project’s network.
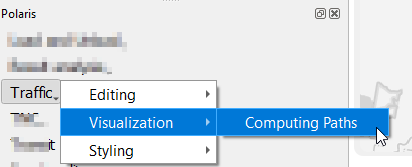

4.2.1. Path computation#
To compute paths over a Polaris model, it is necessary to load the model from disk, which is done when the path-computation interface is loaded, so be patient. When the data is loaded, the user will be presented with the following screen:
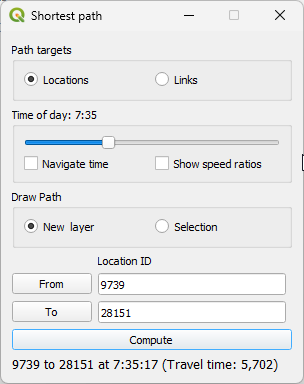
The first option the user has to do is whether they want to compute paths between locations or between links. When computing paths between links, please note that the Polaris router API allows for the computation between any two links on the network, and requires the links and directions for the link of origin AND destination, as well as the departure time, as inputs.
After deciding whether to compute paths between links or locations, the user should choose a departure time for the route, which is populated with 8AM by default.
The user can also decide if they would like the new path to be created as a new layer to which all links that are part of the path will be copied, or if they should be populated as a selection within the link layer.
One thing to note when computing routes between links is that the user is able to select the direction for both the link of origin and link of destination, which can be done by switching the toggle by each one of the select link IDs, highlighted in the image below.
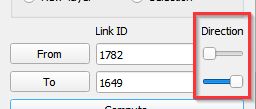
It is important to highlight that, if a link has a single direction of flow, this toggle will be disabled and the direction set to its only valid one. With all these components, the user experience should be smooth after loading the model data.
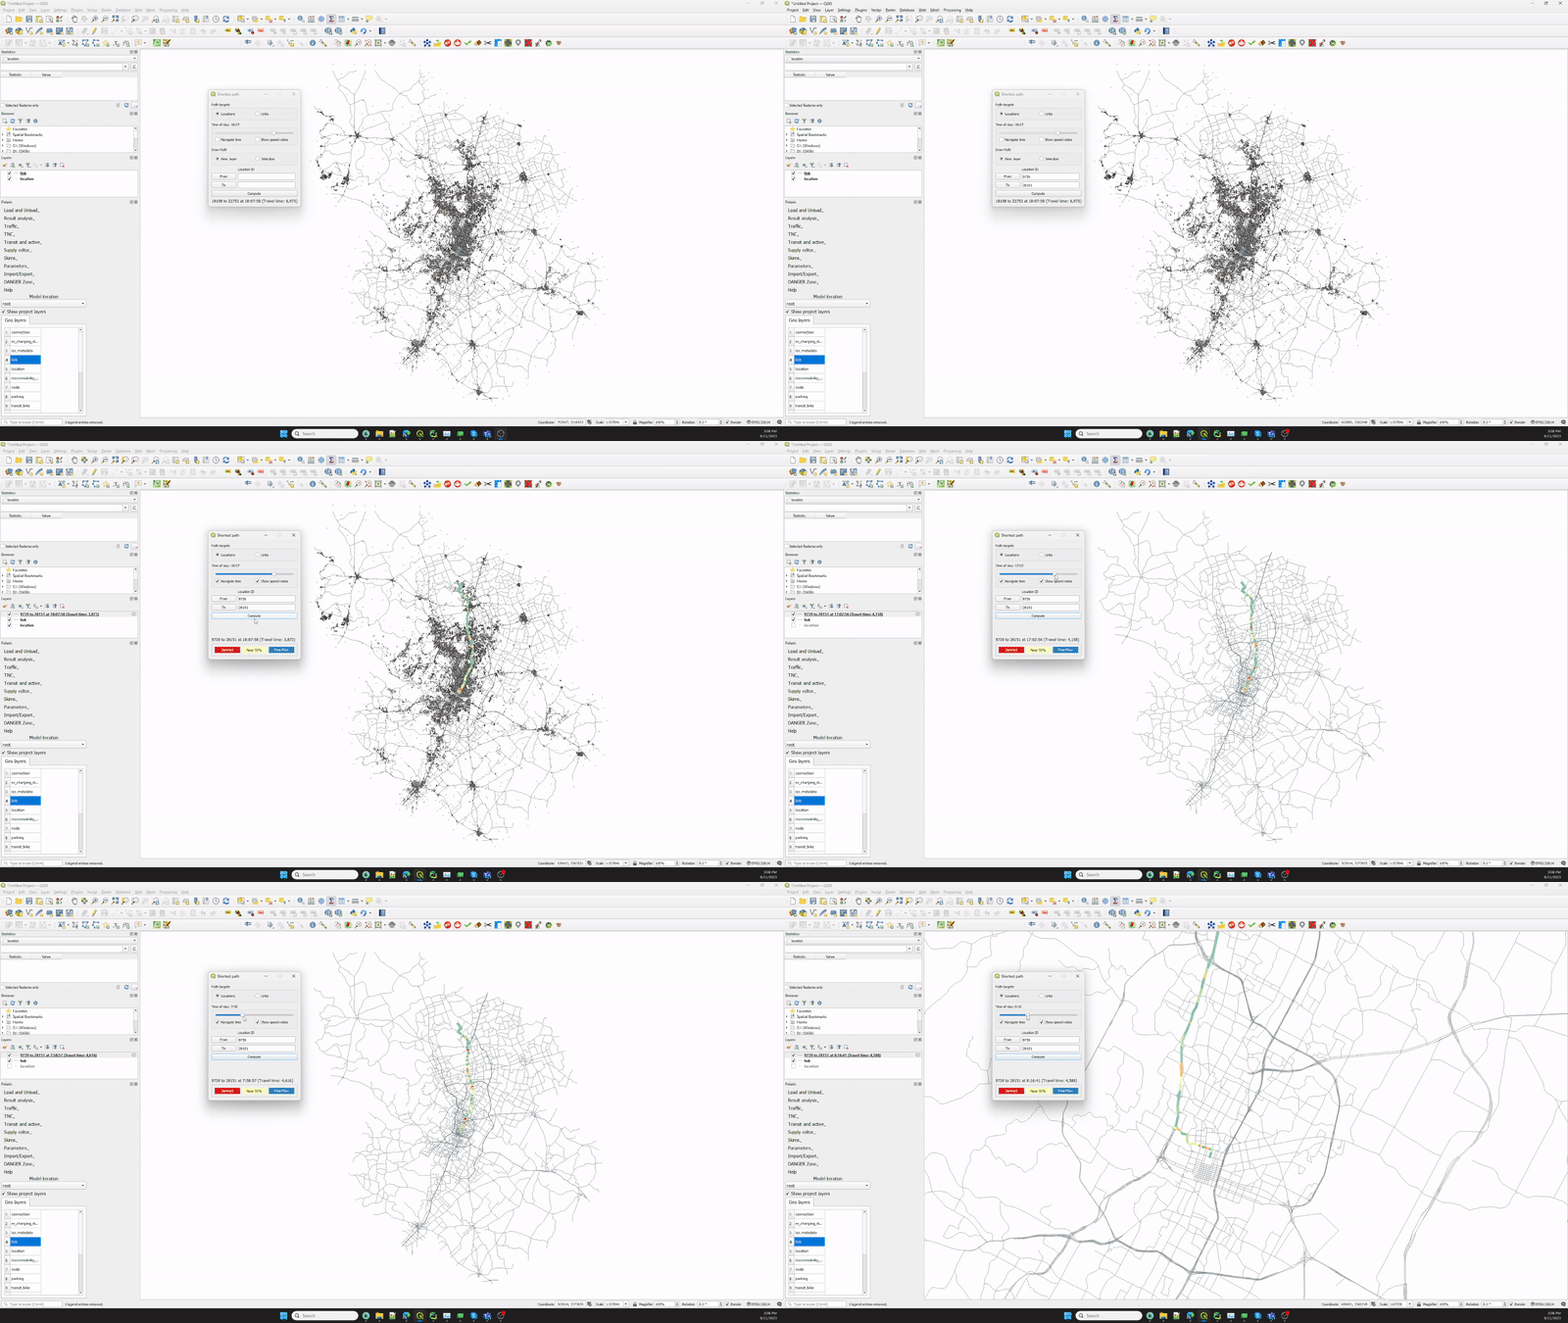
Checking the Show speed ratios box sets the renderization of the path according to the ration between the routed speed and the free-flow-speed from the link layer, varying from nearly zero (or Jammed) in red to 1 (free-flow speed) in blue, as shown in legend box at the bottom of the shortest path tool.
Finally, the user is also able to toggle the Navigate time checkbox, which enables enables on-the-fly change of the last path computed as the user changes the time-of-day slider, as shown in the animation below.
4.3. Styling#
The styling menu gives access to pre-build styles for the links and nodes layer, which should speed up specific analysis.
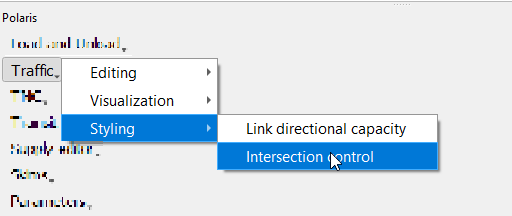
There not many styles currently available, but this list should grow with time.
4.3.1. Link directional capacity#
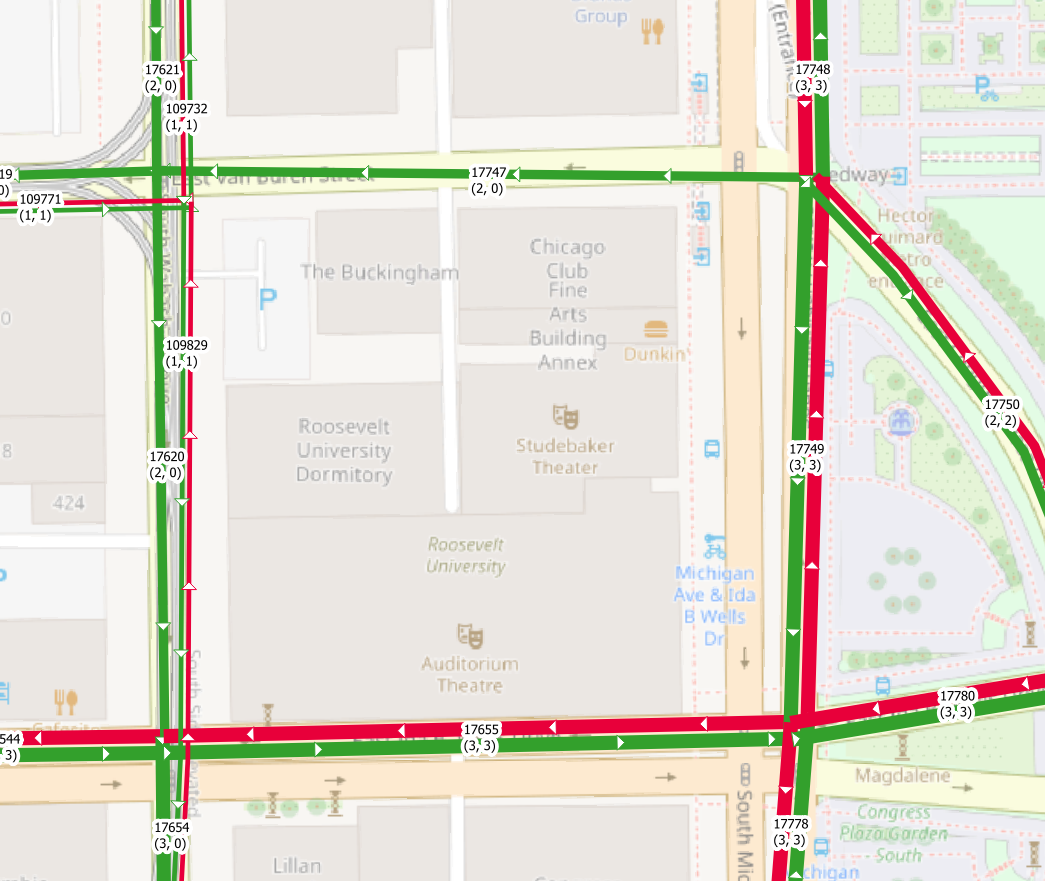
This plots the number of lanes for each direction of a link. The main characteristics of this style are:
Number of lanes are colored by direction in the database (ab_lanes/ba_lanes)
Thickness is proportional to number of lanes and offset to direction of flow
Link ID and number of lanes per direction are on the labels
Its final appearance is similar as to the following:
4.3.2. Intersection control#
Styling intersection controls is a bit different than other layer styling in two critical ways:
To show the complete information it is necessary to style both links and nodes
The information required to correctly style the link layer is not all in one table, so the software creates a query-based based with the required fields.
As a result of these two points, creating the intersection control map is slower than other styles (it may take a few seconds to finish), but it looks like the following:
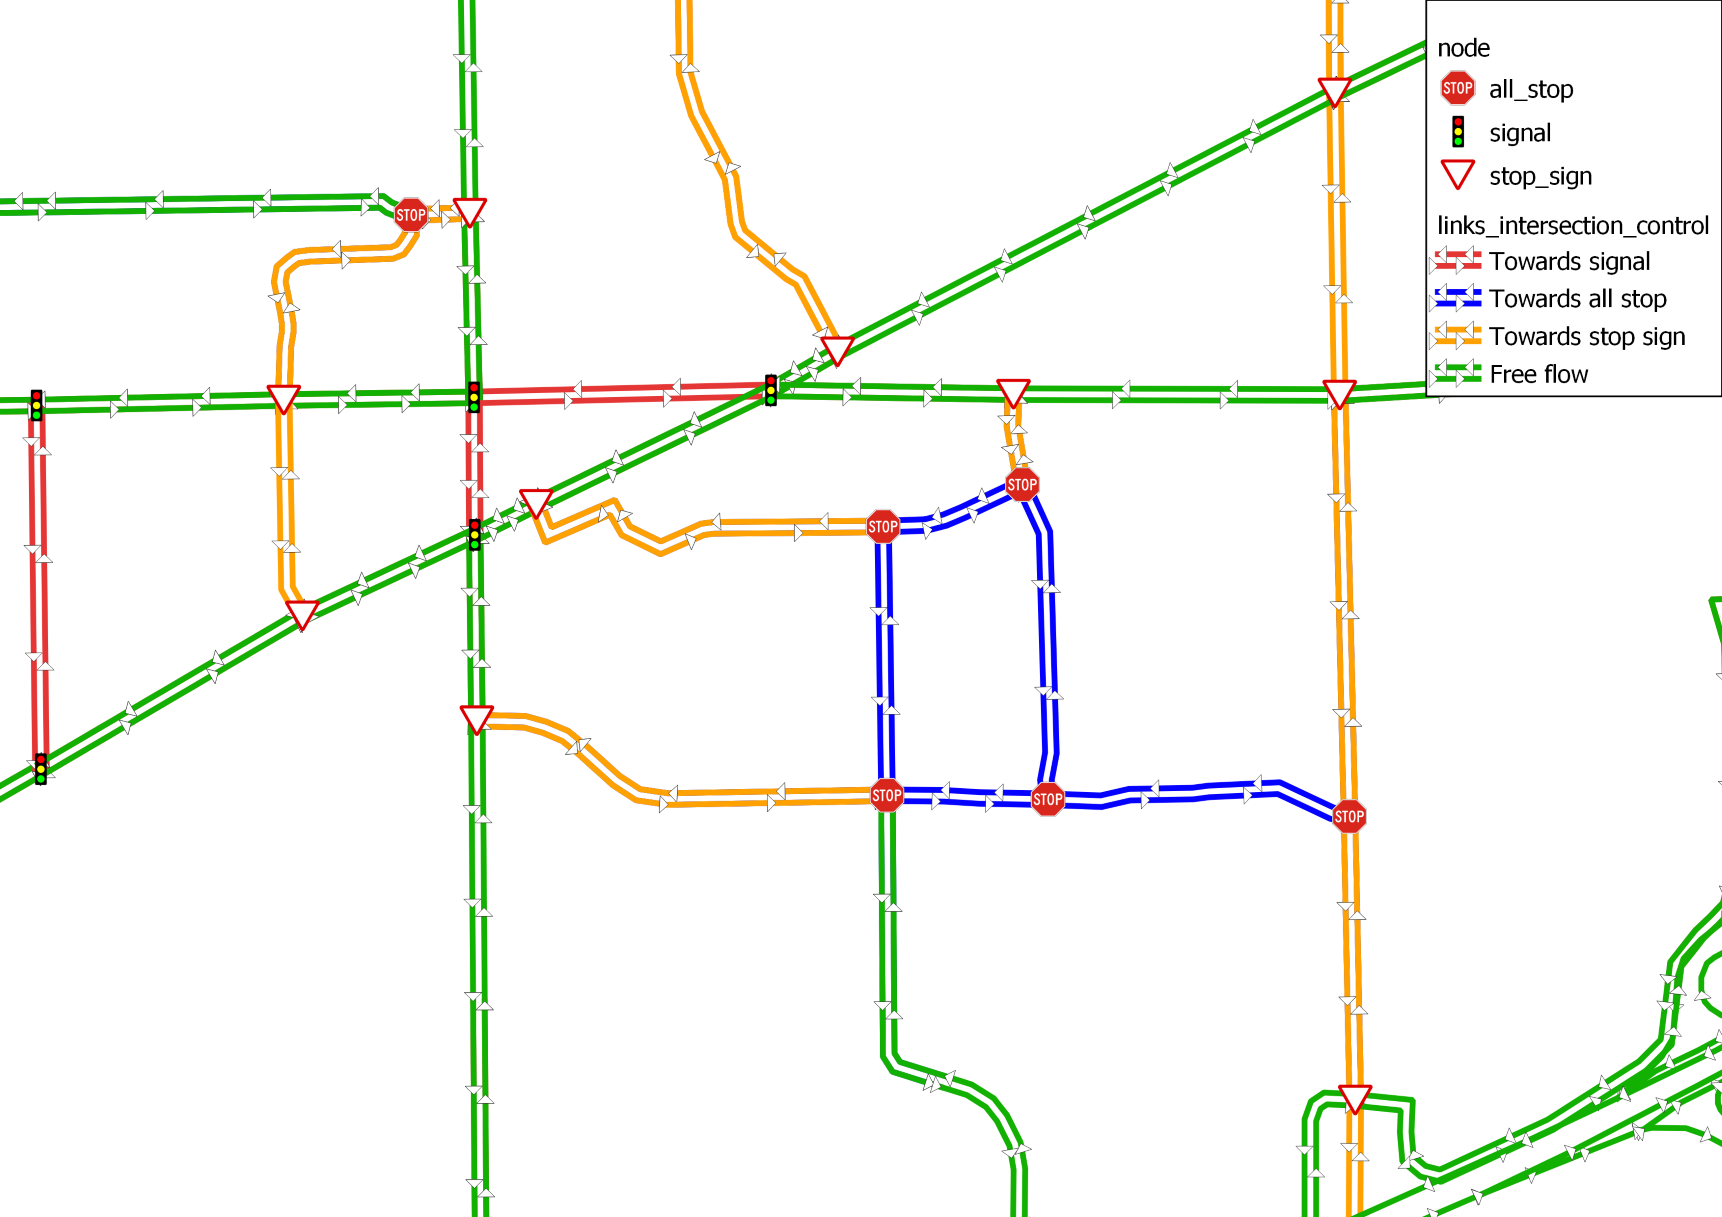
Note that the yield sign indicates the presence of a 2-way stop, while the stop sign icon is reserved for 4-way stops.
Finally, the color of the link has to do with the intersection control type for the node it is going TO.