GUI#
polaris-studio incorporates very basic interface capabilities, mostly dedicated to the result convergence analysis.
The interface can be accessed from a Python terminal (or Jupyter notebook)
from polaris import Polaris
model = Polaris.from_dir(r'c:/models/chicago/run062')
gui = model.gui
gui.demand_comparison()
Or from the command line
`bash
polaris gui --data_dir c:/models/chicago/run062
`
Demand comparison#
Accessing the interface immediately launches an interface with the demand database from all iterations loaded on a list, from which the user can choose which ones to chart at once, as shown below.
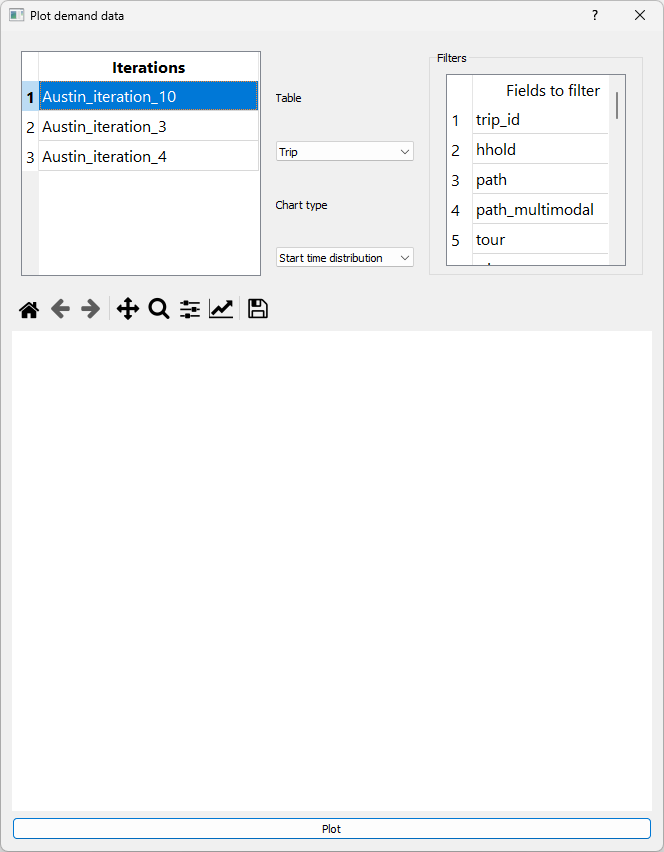
There are four basic controls in the interface:
Iterations to be plotted
Table to draw data from
Type of chart to be produced
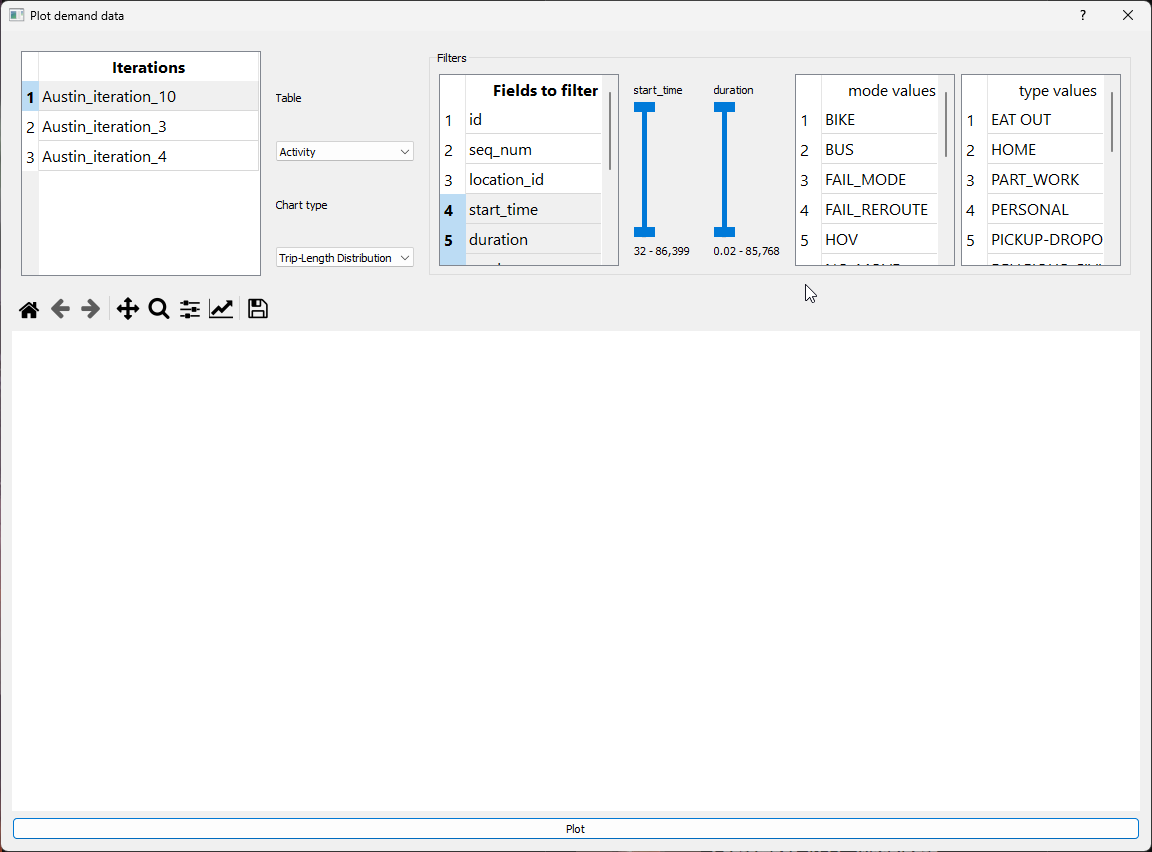
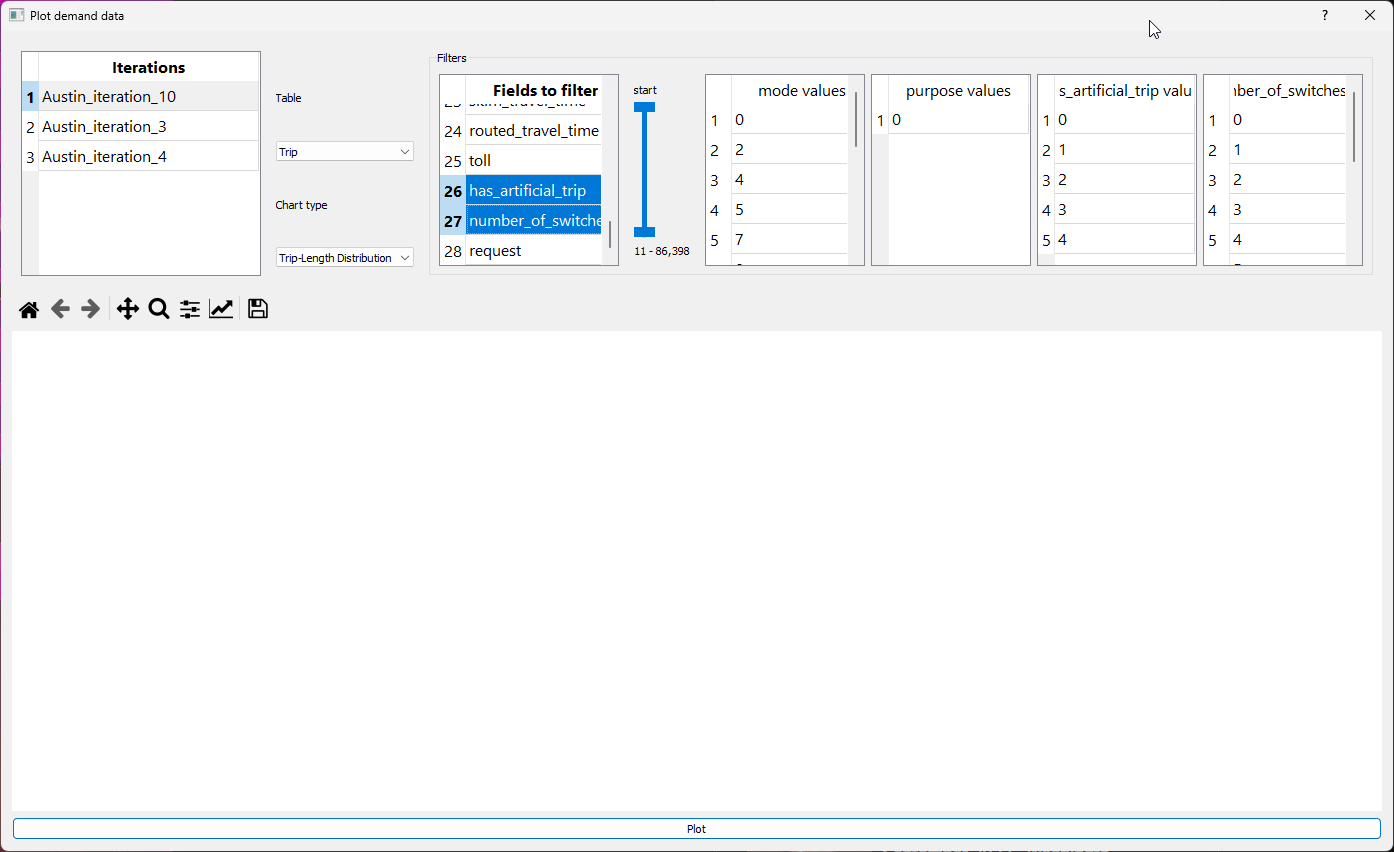
Filters
Data filtering is perhaps the biggest advantage of this interface, as selecting filters from the filters table creates new controls that are either tables or scroll bars, depending on the data type in the database, as illustrated in the two images below.