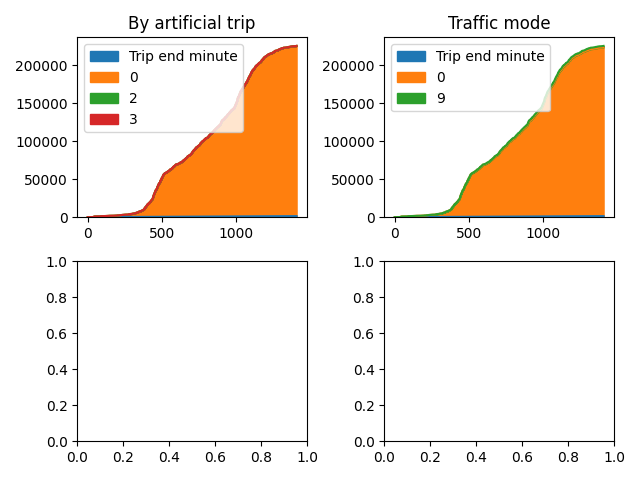
Analyzing traffic convergence#

On this example we show how to use analyze traffic convergence for different segments of the results

Imports#

import sqlite3
from pathlib import Path

import geopandas as gpd
from polaris.analyze.path_metrics import PathMetrics
from polaris.network.data.data_table_cache import DataTableCache
from polaris.network.network import Network
from polaris.runs.scenario_compression import ScenarioCompression
from polaris.runs.scenario_utils import get_last_iteration
from polaris.utils.database.db_utils import read_and_close

Data Sources#

Open the demand database for analysis sphinx_gallery_thumbnail_path = ‘../../examples/result_analysis/map_plot_convergence_analysis.png’

project_dir = Path("/tmp/Bloomington")
iteration_folder = get_last_iteration(project_dir)
demand_db = ScenarioCompression.maybe_extract(Path(iteration_folder) / "Bloomington-Demand.sqlite")
supply_db = ScenarioCompression.maybe_extract(Path(iteration_folder) / "Bloomington-Supply.sqlite")

dem_conn = sqlite3.connect(demand_db)
net = Network()
net.open(supply_db)

Data retrieval#

tm = PathMetrics(supply_file=supply_db, demand_file=demand_db)
with read_and_close(supply_db, spatial=True) as conn:
    zones = DataTableCache(supply_db).plotting_layer("Zone", conn)
    links = DataTableCache(supply_db).plotting_layer("Link", conn)

traces = tm.data
traces = traces[traces.tmode.isin([0, 9, 17, 18, 19, 20])]
traces.head()
object_id value_link value_travel_time value_routed_travel_time value_Number_of_Switches value_Switch_Cause has_artificial_trip tstart tend tmode absolute_gap mstart mend
0 1 5324 23 22.0 0 NO_SWITCHING 0 915.575195 1259.0 0 1.0 15 20
1 1 5327 17 17.0 0 NO_SWITCHING 0 915.575195 1259.0 0 0.0 15 20
2 1 5326 17 17.0 0 NO_SWITCHING 0 915.575195 1259.0 0 0.0 15 20
3 1 2169 29 35.0 0 NO_SWITCHING 0 915.575195 1259.0 0 6.0 15 20
4 1 2170 21 21.0 0 NO_SWITCHING 0 915.575195 1259.0 0 0.0 15 20


Plotting aggregate results#

import matplotlib.pyplot as plt


def chart_metric(df, metric: str, axis=None):
    data = df.rename(columns={"mend": "Trip end minute"})
    data = data.groupby([metric, "Trip end minute"]).sum()[["absolute_gap"]].reset_index()

    pvt = data.pivot_table(index="Trip end minute", values="absolute_gap", columns=metric, fill_value=0)
    for c in data[metric].unique():
        pvt[c] = pvt[c].cumsum()

    if axis is None:
        pvt.plot.area()
        plt.title("Cummulative absolute gap")
        plt.show()
    else:
        pvt.plot.area(ax=axis)

We can plot many figures together#

fig, axis = plt.subplots(2, 2)

chart_metric(traces, "value_Switch_Cause", axis[0, 0])
chart_metric(traces, "value_Number_of_Switches", axis[0, 1])
chart_metric(traces, "has_artificial_trip", axis[1, 0])
chart_metric(traces, "tmode", axis[1, 1])

# Combine all the operations and display
plt.tight_layout()
plt.show()
plot convergence analysis

Or one at a time#

chart_metric(traces, "value_Switch_Cause")
Cummulative absolute gap

Cummulative charts#

import seaborn as sns
import matplotlib.pyplot as plt

cumm_links = gap_per_link.sort_values(by=["absolute_gap"], ascending=False).reset_index(drop=True)
cumm_links = cumm_links.assign(cummulative_relative_gap=cumm_links.absolute_gap.cumsum())
cumm_links.cummulative_relative_gap /= cumm_links.cummulative_relative_gap.max()

sns.lineplot(data=cumm_links["cummulative_relative_gap"])
plt.xlabel("link count")
plot convergence analysis
Text(0.5, 23.52222222222222, 'link count')

And map them#

print(
    "REFERENCE: And below we map links and zones according to gaps. The maps should look like this, "
    "but will need formatting"
)
REFERENCE: And below we map links and zones according to gaps. The maps should look like this, but will need formatting
map_zone_config = {
    "version": "v1",
    "config": {
        "visState": {
            "filters": [],
            "layers": [
                {
                    "id": "z0w117",
                    "type": "geojson",
                    "config": {
                        "dataId": "Total gaps",
                        "label": "Total gaps",
                        "color": [34, 63, 154],
                        "highlightColor": [252, 242, 26, 255],
                        "columns": {"geojson": "geometry"},
                        "isVisible": True,
                        "visConfig": {
                            "opacity": 0.8,
                            "strokeOpacity": 0.8,
                            "thickness": 0.1,
                            "strokeColor": [221, 212, 205],
                            "colorRange": {
                                "name": "Uber Viz Diverging 1.5",
                                "type": "diverging",
                                "category": "Uber",
                                "colors": ["#00939C", "#5DBABF", "#BAE1E2", "#F8C0AA", "#DD7755", "#C22E00"],
                            },
                            "strokeColorRange": {
                                "name": "Global Warming",
                                "type": "sequential",
                                "category": "Uber",
                                "colors": ["#5A1846", "#900C3F", "#C70039", "#E3611C", "#F1920E", "#FFC300"],
                            },
                            "radius": 10,
                            "sizeRange": [0, 10],
                            "radiusRange": [0, 50],
                            "heightRange": [0, 500],
                            "elevationScale": 27.8,
                            "enableElevationZoomFactor": True,
                            "stroked": True,
                            "filled": True,
                            "enable3d": True,
                            "wireframe": False,
                        },
                        "hidden": False,
                        "textLabel": [
                            {
                                "field": None,
                                "color": [255, 255, 255],
                                "size": 18,
                                "offset": [0, 0],
                                "anchor": "start",
                                "alignment": "center",
                            }
                        ],
                    },
                    "visualChannels": {
                        "colorField": {"name": "absolute_gap", "type": "integer"},
                        "colorScale": "quantile",
                        "strokeColorField": None,
                        "strokeColorScale": "quantile",
                        "sizeField": None,
                        "sizeScale": "linear",
                        "heightField": {"name": "relative_gap", "type": "real"},
                        "heightScale": "linear",
                        "radiusField": None,
                        "radiusScale": "linear",
                    },
                }
            ],
            "interactionConfig": {
                "tooltip": {
                    "fieldsToShow": {
                        "Total gaps": [
                            {"name": "zone", "format": None},
                            {"name": "absolute_gap", "format": None},
                            {"name": "relative_gap", "format": ".1%"},
                        ]
                    },
                    "compareMode": False,
                    "compareType": "absolute",
                    "enabled": True,
                },
                "brush": {"size": 0.5, "enabled": False},
                "geocoder": {"enabled": False},
                "coordinate": {"enabled": False},
            },
            "layerBlending": "normal",
            "splitMaps": [],
            "animationConfig": {"currentTime": None, "speed": 1},
        },
        "mapState": {
            "bearing": 24,
            "dragRotate": True,
            "latitude": map_center[1],
            "longitude": map_center[0],
            "pitch": 50,
            "zoom": 9.096117833833905,
            "isSplit": False,
        },
        "mapStyle": {
            "styleType": "muted",
            "topLayerGroups": {},
            "visibleLayerGroups": {
                "label": True,
                "road": False,
                "border": False,
                "building": True,
                "water": True,
                "land": True,
                "3d building": False,
            },
            "threeDBuildingColor": [224.4071295378559, 224.4071295378559, 224.4071295378559],
            "mapStyles": {},
        },
    },
}
from keplergl import KeplerGl

map1 = KeplerGl(height=900, data={"Total gaps": plot_zone_layer}, config=map_zone_config)

map1
User Guide: https://docs.kepler.gl/docs/keplergl-jupyter

KeplerGl(config={'version': 'v1', 'config': {'visState': {'filters': [], 'layers': [{'id': 'z0w117', 'type': 'geojson', 'config': {'dataId': 'Total gaps', 'label': 'Total gaps', 'color': [34, 63, 154], 'highlightColor': [252, 242, 26, 255], 'columns': {'geojson': 'geometry'}, 'isVisible': True, 'visConfig': {'opacity': 0.8, 'strokeOpacity': 0.8, 'thickness': 0.1, 'strokeColor': [221, 212, 205], 'colorRange': {'name': 'Uber Viz Diverging 1.5', 'type': 'diverging', 'category': 'Uber', 'colors': ['#00939C', '#5DBABF', '#BAE1E2', '#F8C0AA', '#DD7755', '#C22E00']}, 'strokeColorRange': {'name': 'Global Warming', 'type': 'sequential', 'category': 'Uber', 'colors': ['#5A1846', '#900C3F', '#C70039', '#E3611C', '#F1920E', '#FFC300']}, 'radius': 10, 'sizeRange': [0, 10], 'radiusRange': [0, 50], 'heightRange': [0, 500], 'elevationScale': 27.8, 'enableElevationZoomFactor': True, 'stroked': True, 'filled': True, 'enable3d': True, 'wireframe': False}, 'hidden': False, 'textLabel': [{'field': None, 'color': [255, 255, 255], 'size': 18, 'offset': [0, 0], 'anchor': 'start', 'alignment': 'center'}]}, 'visualChannels': {'colorField': {'name': 'absolute_gap', 'type': 'integer'}, 'colorScale': 'quantile', 'strokeColorField': None, 'strokeColorScale': 'quantile', 'sizeField': None, 'sizeScale': 'linear', 'heightField': {'name': 'relative_gap', 'type': 'real'}, 'heightScale': 'linear', 'radiusField': None, 'radiusScale': 'linear'}}], 'interactionConfig': {'tooltip': {'fieldsToShow': {'Total gaps': [{'name': 'zone', 'format': None}, {'name': 'absolute_gap', 'format': None}, {'name': 'relative_gap', 'format': '.1%'}]}, 'compareMode': False, 'compareType': 'absolute', 'enabled': True}, 'brush': {'size': 0.5, 'enabled': False}, 'geocoder': {'enabled': False}, 'coordinate': {'enabled': False}}, 'layerBlending': 'normal', 'splitMaps': [], 'animationConfig': {'currentTime': None, 'speed': 1}}, 'mapState': {'bearing': 24, 'dragRotate': True, 'latitude': 40.49083374959828, 'longitude': -88.97889575473327, 'pitch': 50, 'zoom': 9.096117833833905, 'isSplit': False}, 'mapStyle': {'styleType': 'muted', 'topLayerGroups': {}, 'visibleLayerGroups': {'label': True, 'road': False, 'border': False, 'building': True, 'water': True, 'land': True, '3d building': False}, 'threeDBuildingColor': [224.4071295378559, 224.4071295378559, 224.4071295378559], 'mapStyles': {}}}}, data={'Total gaps':      zone  ...  absolute_gap
0      11  ...         991.0
1      22  ...         134.0
2      25  ...         158.0
3      27  ...         751.0
4      28  ...         338.0
..    ...  ...           ...
179   287  ...        2516.0
180   292  ...        3464.0
181   293  ...        3445.0
182   296  ...         389.0
183   297  ...        1065.0

[184 rows x 32 columns]}, height=900)
link_config = {
    "version": "v1",
    "config": {
        "visState": {
            "filters": [],
            "layers": [
                {
                    "id": "xiykhj",
                    "type": "geojson",
                    "config": {
                        "dataId": "Total gaps",
                        "label": "Total gaps",
                        "color": [248, 149, 112],
                        "highlightColor": [252, 242, 26, 255],
                        "columns": {"geojson": "geometry"},
                        "isVisible": True,
                        "visConfig": {
                            "opacity": 0.8,
                            "strokeOpacity": 1,
                            "thickness": 0.5,
                            "strokeColor": None,
                            "colorRange": {
                                "name": "Global Warming",
                                "type": "sequential",
                                "category": "Uber",
                                "colors": ["#5A1846", "#900C3F", "#C70039", "#E3611C", "#F1920E", "#FFC300"],
                            },
                            "strokeColorRange": {
                                "name": "Uber Viz Diverging 3.5",
                                "type": "diverging",
                                "category": "Uber",
                                "colors": [
                                    "#00939C",
                                    "#2FA7AE",
                                    "#5DBABF",
                                    "#8CCED1",
                                    "#BAE1E2",
                                    "#F8C0AA",
                                    "#EB9C80",
                                    "#DD7755",
                                    "#D0532B",
                                    "#C22E00",
                                ],
                            },
                            "radius": 10,
                            "sizeRange": [0.2, 20],
                            "radiusRange": [0, 50],
                            "heightRange": [0, 500],
                            "elevationScale": 5,
                            "enableElevationZoomFactor": True,
                            "stroked": True,
                            "filled": False,
                            "enable3d": False,
                            "wireframe": False,
                        },
                        "hidden": False,
                        "textLabel": [
                            {
                                "field": None,
                                "color": [255, 255, 255],
                                "size": 18,
                                "offset": [0, 0],
                                "anchor": "start",
                                "alignment": "center",
                            }
                        ],
                    },
                    "visualChannels": {
                        "colorField": None,
                        "colorScale": "quantile",
                        "strokeColorField": {"name": "absolute_gap", "type": "integer"},
                        "strokeColorScale": "quantile",
                        "sizeField": {"name": "absolute_gap", "type": "integer"},
                        "sizeScale": "linear",
                        "heightField": None,
                        "heightScale": "linear",
                        "radiusField": None,
                        "radiusScale": "linear",
                    },
                }
            ],
            "interactionConfig": {
                "tooltip": {
                    "fieldsToShow": {
                        "Total gaps": [{"name": "link", "format": None}, {"name": "absolute_gap", "format": None}]
                    },
                    "compareMode": False,
                    "compareType": "absolute",
                    "enabled": True,
                },
                "brush": {"size": 0.5, "enabled": False},
                "geocoder": {"enabled": False},
                "coordinate": {"enabled": False},
            },
            "layerBlending": "normal",
            "splitMaps": [],
            "animationConfig": {"currentTime": None, "speed": 1},
        },
        "mapState": {
            "bearing": 0,
            "dragRotate": False,
            "latitude": map_center[1],
            "longitude": map_center[0],
            "pitch": 0,
            "zoom": 8.42575627208353,
            "isSplit": False,
        },
        "mapStyle": {
            "styleType": "muted",
            "topLayerGroups": {},
            "visibleLayerGroups": {
                "label": False,
                "road": False,
                "border": False,
                "building": True,
                "water": True,
                "land": True,
                "3d building": False,
            },
            "threeDBuildingColor": [224.4071295378559, 224.4071295378559, 224.4071295378559],
            "mapStyles": {},
        },
    },
}
from keplergl import KeplerGl

map2 = KeplerGl(height=900, data={"Total gaps": plot_link_layer}, config=link_config)

map2
User Guide: https://docs.kepler.gl/docs/keplergl-jupyter

KeplerGl(config={'version': 'v1', 'config': {'visState': {'filters': [], 'layers': [{'id': 'xiykhj', 'type': 'geojson', 'config': {'dataId': 'Total gaps', 'label': 'Total gaps', 'color': [248, 149, 112], 'highlightColor': [252, 242, 26, 255], 'columns': {'geojson': 'geometry'}, 'isVisible': True, 'visConfig': {'opacity': 0.8, 'strokeOpacity': 1, 'thickness': 0.5, 'strokeColor': None, 'colorRange': {'name': 'Global Warming', 'type': 'sequential', 'category': 'Uber', 'colors': ['#5A1846', '#900C3F', '#C70039', '#E3611C', '#F1920E', '#FFC300']}, 'strokeColorRange': {'name': 'Uber Viz Diverging 3.5', 'type': 'diverging', 'category': 'Uber', 'colors': ['#00939C', '#2FA7AE', '#5DBABF', '#8CCED1', '#BAE1E2', '#F8C0AA', '#EB9C80', '#DD7755', '#D0532B', '#C22E00']}, 'radius': 10, 'sizeRange': [0.2, 20], 'radiusRange': [0, 50], 'heightRange': [0, 500], 'elevationScale': 5, 'enableElevationZoomFactor': True, 'stroked': True, 'filled': False, 'enable3d': False, 'wireframe': False}, 'hidden': False, 'textLabel': [{'field': None, 'color': [255, 255, 255], 'size': 18, 'offset': [0, 0], 'anchor': 'start', 'alignment': 'center'}]}, 'visualChannels': {'colorField': None, 'colorScale': 'quantile', 'strokeColorField': {'name': 'absolute_gap', 'type': 'integer'}, 'strokeColorScale': 'quantile', 'sizeField': {'name': 'absolute_gap', 'type': 'integer'}, 'sizeScale': 'linear', 'heightField': None, 'heightScale': 'linear', 'radiusField': None, 'radiusScale': 'linear'}}], 'interactionConfig': {'tooltip': {'fieldsToShow': {'Total gaps': [{'name': 'link', 'format': None}, {'name': 'absolute_gap', 'format': None}]}, 'compareMode': False, 'compareType': 'absolute', 'enabled': True}, 'brush': {'size': 0.5, 'enabled': False}, 'geocoder': {'enabled': False}, 'coordinate': {'enabled': False}}, 'layerBlending': 'normal', 'splitMaps': [], 'animationConfig': {'currentTime': None, 'speed': 1}}, 'mapState': {'bearing': 0, 'dragRotate': False, 'latitude': 40.49083374959828, 'longitude': -88.97889575473327, 'pitch': 0, 'zoom': 8.42575627208353, 'isSplit': False}, 'mapStyle': {'styleType': 'muted', 'topLayerGroups': {}, 'visibleLayerGroups': {'label': False, 'road': False, 'border': False, 'building': True, 'water': True, 'land': True, '3d building': False}, 'threeDBuildingColor': [224.4071295378559, 224.4071295378559, 224.4071295378559], 'mapStyles': {}}}}, data={'Total gaps':       link                 name  ...  value_link  absolute_gap
0        4       Landmark Drive  ...         4.0          24.0
1        6       Landmark Drive  ...         6.0          32.0
2       10       Mecherle Drive  ...         NaN           NaN
3       11       Mecherle Drive  ...         NaN           NaN
4       12       Mecherle Drive  ...        12.0           1.0
...    ...                  ...  ...         ...           ...
4522  5993  Brigham School Road  ...      5993.0          13.0
4523  5994    South Main Street  ...      5994.0          68.0
4524  5995    South Main Street  ...      5995.0          59.0
4525  5996    South Main Street  ...      5996.0          56.0
4526  5997    South Main Street  ...      5997.0          15.0

[4527 rows x 23 columns]}, height=900)

Closes project

net.close()

Total running time of the script: (0 minutes 2.157 seconds)

Gallery generated by Sphinx-Gallery