Note
Go to the end to download the full example code.
Exporting trips to zonal matrices#
To support the Polaris demand to be assigned to networks using static traffic assignment available in commonly used modelling packages, Polaris-Studio has a convenient tool for exporting demand into a traditional demand matrix format
Exporting matrices#
sphinx_gallery_thumbnail_path = ‘../../examples/modelling_like_the_old_days/matrix.png’
from pathlib import Path

import pandas as pd

from polaris.analyze.activity_metrics import ActivityMetrics
from polaris.analyze.trip_metrics import TripMetrics
from polaris.runs.convergence.convergence_iteration import ConvergenceIteration
from polaris.utils.testing.temp_model import TempModel
We get the demand matrices for two separate iterations#
project_dir = TempModel("Bloomington")

iteration_1 = ConvergenceIteration.from_dir(project_dir / "Bloomington_iteration_1")
tm1 = TripMetrics(project_dir / "Bloomington-Supply.sqlite", iteration_1.files.demand_db)
# Let's get the morning peak matrix
# Let's say that the peak time is from 6:45AM to 8:45AM, so we get trips starting during that time
mat1 = tm1.trip_matrix(from_start_time=6.75 * 3600, to_start_time=8.75 * 3600)

iteration_2 = ConvergenceIteration.from_dir(project_dir / "Bloomington_iteration_2")
tm2 = TripMetrics(project_dir / "Bloomington-Supply.sqlite", iteration_1.files.demand_db)
# Same for the 4th iteration
mat2 = tm2.trip_matrix(from_start_time=6.75 * 3600, to_start_time=8.75 * 3600)
We can also get trip matrices for other trip times. To see what modes are available, you can call
print(tm2.available_modes)

transit_iter4 = tm2.trip_matrix(from_start_time=6.75 * 3600, to_start_time=8.75 * 3600, modes=["BUS"])

print(transit_iter4.BUS.sum())
['SOV', 'AUTO_NEST', 'HOV', 'TRUCK', 'BUS', 'RAIL', 'NONMOTORIZED_NEST', 'BICYCLE', 'WALK', 'TAXI', 'SCHOOLBUS', 'PARK_AND_RIDE', 'KISS_AND_RIDE', 'PARK_AND_RAIL', 'KISS_AND_RAIL', 'TNC_AND_RIDE', 'MD_TRUCK', 'HD_TRUCK', 'BPLATE', 'LD_TRUCK', 'RAIL_NEST', 'BUS40', 'BUS60', 'PNR_BIKE NEST', 'RIDE_AND_UNPARK', 'RIDE_AND_REKISS', 'RAIL_AND_UNPARK', 'RAIL_AND_REKISS', 'MICROM', 'MICROM_NODOCK', 'MICROM_AND_TRANSIT', 'MICROM_NODOCK_AND_TRANSIT', 'ODDELIVERY', 'FAIL_MODE']
328.0
We can also look at matrices from PLANNED ACTIVITIES These matrices contain only trips by CAR
act_metr = ActivityMetrics(project_dir / "Bloomington-Supply.sqlite", iteration_1.files.demand_db)
act_matr3 = act_metr.vehicle_trip_matrix(from_start_time=6.75 * 3600, to_start_time=8.75 * 3600)
We can export the matrices to OMX
mat1.to_aeq().export("/tmp/am_peak_iter1.omx")
mat2.to_aeq().export("/tmp/am_peak_iter2.omx")
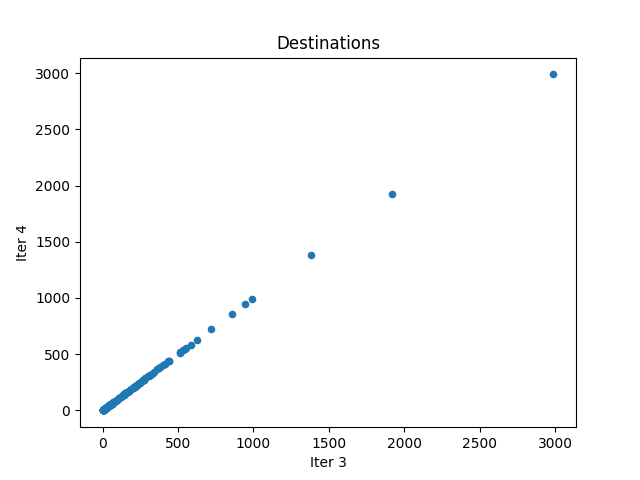
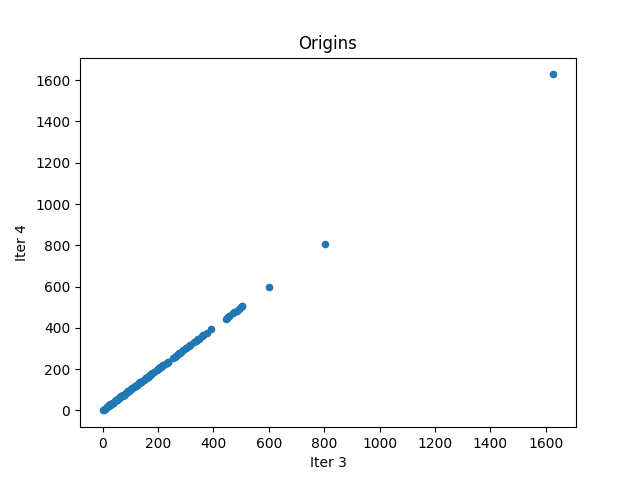
Since we have the matrices in memory, we can compare the marginals for SOV trips at zone levels
# the names of matrices we have
print(mat2.names)

i1 = mat1.SOV.sum(axis=1)
i2 = mat2.SOV.sum(axis=1)

pd.DataFrame({"Iter 1": i1, "Iter 2": i2}).plot.scatter(x="Iter 1", y="Iter 2", title="Destinations")

i1 = mat1.SOV.sum(axis=0)
i2 = mat2.SOV.sum(axis=0)

pd.DataFrame({"Iter 1": i1, "Iter 2": i2}).plot.scatter(x="Iter 1", y="Iter 2", title="Origins")
None

<Axes: title={'center': 'Origins'}, xlabel='Iter 1', ylabel='Iter 2'>
Total running time of the script: (0 minutes 4.099 seconds)