Note
Go to the end to download the full example code.
Examining Memory#
In this example we show how to look at the memory_logging.csv output file which can be generated using specially compiled versions of the POLARIS executable. See the memory usage section of the POLARIS system architecture documentation for more details on enabling this feature.
We first load up the csv file and adjust the names for readability.
from pathlib import Path
import pandas as pd
from polaris.utils.file_utils import get_caller_directory

output_dir = get_caller_directory() / "data"
df = pd.read_csv(output_dir / "memory_logging.csv")
df["Typename"] = df.Typename.str.replace(".*_Components::Implementations::", "", regex=True)
df["Typename"] = df.Typename.str.replace(
    "_Implementation<MasterType, polaris::TypeList<polaris::NULLTYPE, polaris::NULLTYPE>, void>", ""
)
df["Hour"] = df.Iteration / 3600
df["MBytes"] = df.KBytes / 1024
df
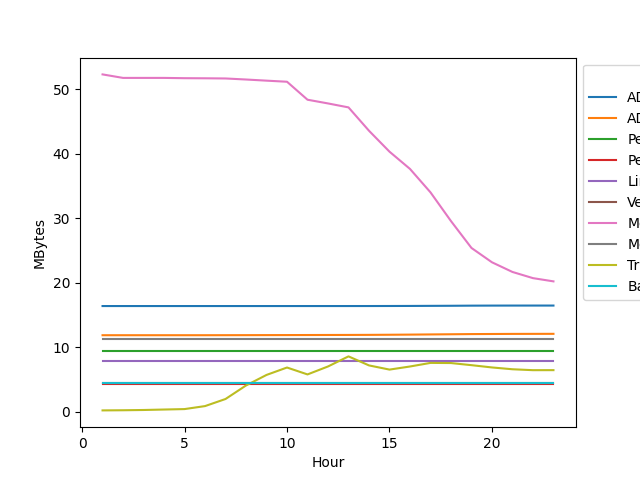
We then find the 10 object types with the highest peak memory use and plot them over the entire simulation period.
import seaborn as sns

# Get the n biggest memory users
n = 10
peak_mem = df.groupby("Typename")["KBytes"].max()
biggest_mem_usage = peak_mem.sort_values(ascending=False)[0:n].index
df_ = df[df.Typename.isin(biggest_mem_usage)]

# Plot them
ax = sns.lineplot(df_, x="Hour", y="MBytes", hue="Typename")
sns.move_legend(ax, "upper left", bbox_to_anchor=(1, 1))

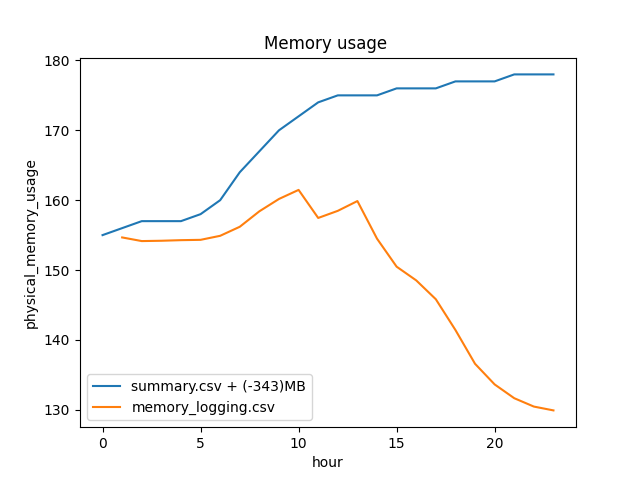
This analysis doesn’t tell the whole story though as it doesn’t account for any dynamically allocated memory (i.e. via a vector<float> .resize() or .push_back()). From the summary file we can get a reading of what the operating system thought our total memory footprint was and this can show the same trends but exposes the inability to reliably release memory back to the OS.
When running on Grid - we see about a 345MB delta over and above the 150MB of memory that is tracked via memory_logging.csv and we also see that the memory footprint continues to go up even as the space occupied by allocated objects goes down.
df_ = df.groupby("Hour")[["MBytes"]].sum()

summary = output_dir / "summary.csv"
summary = pd.read_csv(summary)
cols = list(summary.columns) + ["unknown"]
summary = summary.reset_index()
summary.columns = cols
summary["hour"] = (summary.simulated_time / 3600).astype(int)
summary = summary.groupby("hour")[["physical_memory_usage"]].max()

offset = round(summary.physical_memory_usage.iloc[0] - df_.MBytes.iloc[0])
summary["physical_memory_usage"] = summary.physical_memory_usage - offset

ax = sns.lineplot(summary, x="hour", y="physical_memory_usage", label=f"summary.csv + (-{offset})MB")
sns.lineplot(df_, x="Hour", y="MBytes", ax=ax, label="memory_logging.csv")
ax.set_title(f"Memory usage ")
sns.move_legend(ax, "lower left")

Total running time of the script: (0 minutes 0.607 seconds)