Note
Go to the end to download the full example code.
Comparing Model Outputs#
In this example we show how to compare outputs across iterations or across models. Here we illustrate using two iterations from the same project, but thanks to the use of standardised KPIs, results can be compared across model years or even across cities.
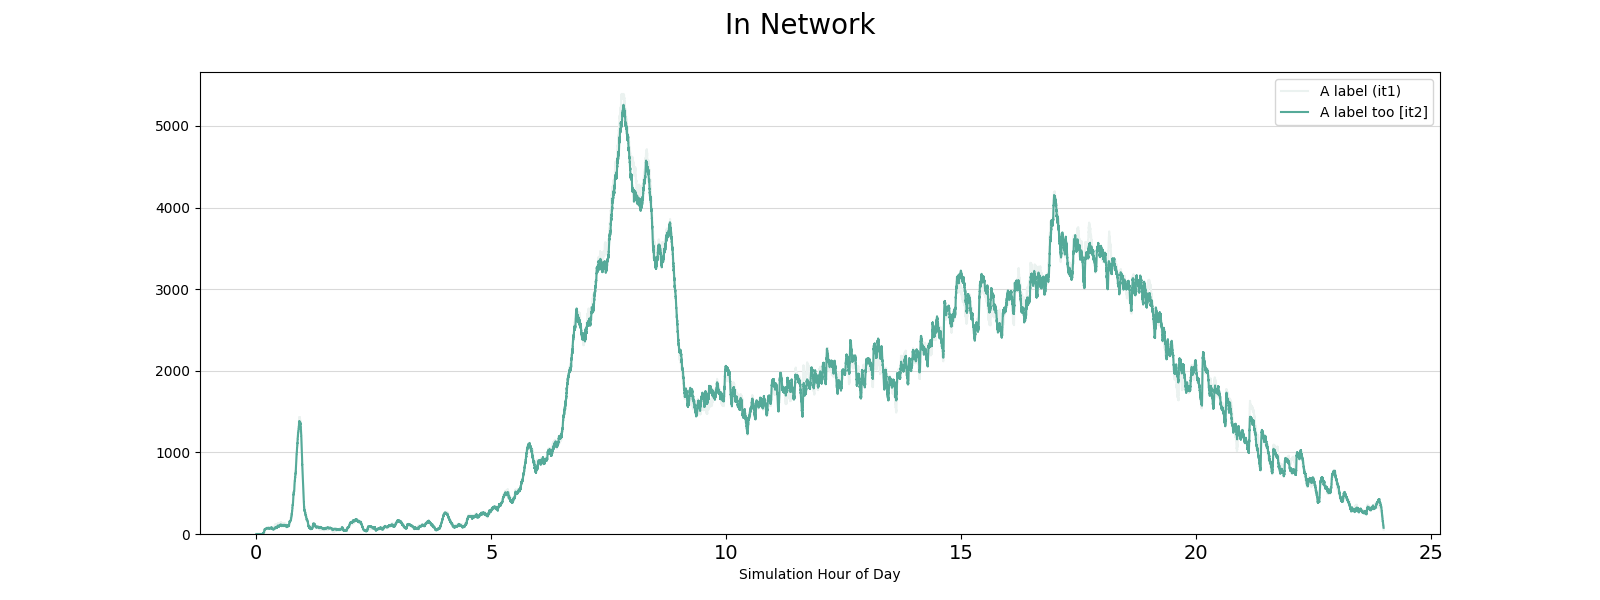
sphinx_gallery_thumbnail_path = ‘../../examples/result_analysis/pax_in_network.png’
from pathlib import Path

from polaris.analyze.kpi_comparator import KpiComparator
from polaris.analyze.result_kpis import ResultKPIs
from polaris.runs.convergence.convergence_iteration import ConvergenceIteration
from polaris.runs.scenario_compression import ScenarioCompression
from polaris.utils.database.migration_manager import MigrationManager
from polaris.utils.database.standard_database import DatabaseType
from polaris.utils.testing.temp_model import TempModel
project_dir = TempModel("Bloomington")

iteration_1 = ConvergenceIteration.from_dir(project_dir / "Bloomington_iteration_1")
iteration_2 = ConvergenceIteration.from_dir(project_dir / "Bloomington_iteration_2")

# This is generally not needed unless you are analysing results from an older model
# MigrationManager.upgrade(
#     ScenarioCompression.maybe_extract(iteration_1.files.demand_db), DatabaseType.Demand, redo_triggers=False
# )
# MigrationManager.upgrade(
#     ScenarioCompression.maybe_extract(iteration_2.files.demand_db), DatabaseType.Demand, redo_triggers=False
# )

c = KpiComparator()
c.add_run(ResultKPIs.from_iteration(iteration_1), "A label (it1)")
c.add_run(ResultKPIs.from_iteration(iteration_2), "A label too [it2]")
c.plot_everything()
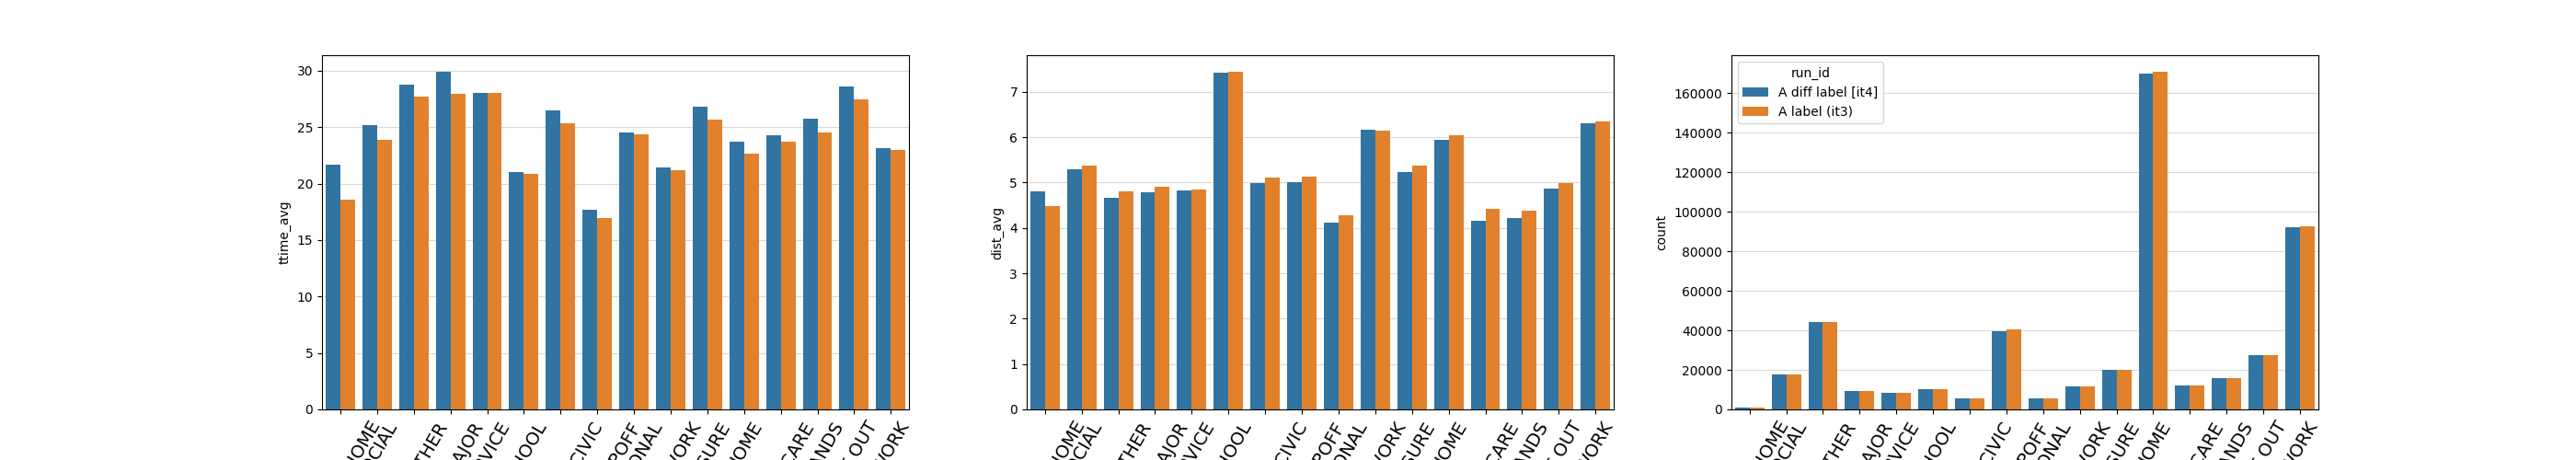


plot_act_dist
plot_activity_start_time_distributions
plot_calibration_destination
plot_calibration_for_activity_generation
plot_calibration_for_boardings
plot_calibration_for_mode_share
plot_calibration_timing
plot_congestion_pricing
plot_congestion_removal
plot_count_validation
plot_count_validation: failed
plot_cpu_mem
plot_energy
plot_energy: failed
plot_escooter_utilization_at_garage
plot_externals
plot_freight_distance_distribution_by_mode
plot_freight_in_network
plot_freight_shipment_count_share_by_mode
plot_fuel_consumption
plot_fuel_consumption: failed
plot_fundamental_diagram
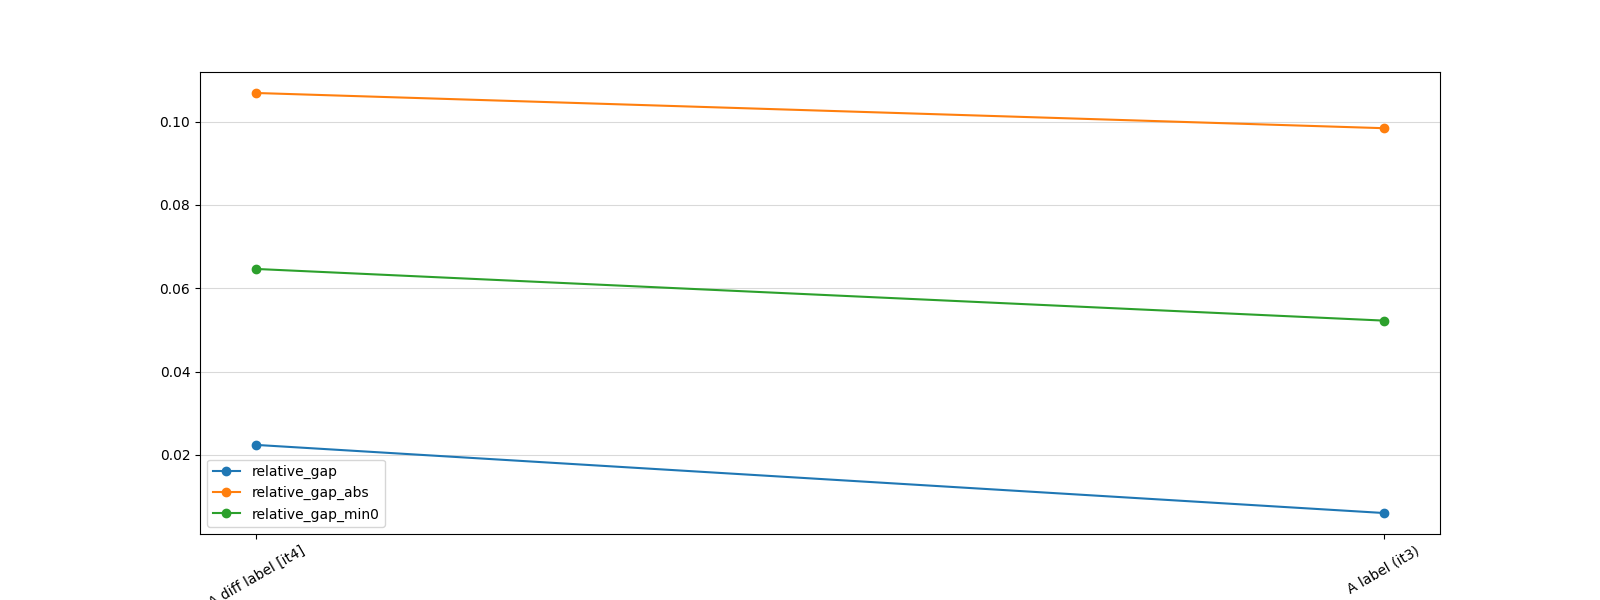
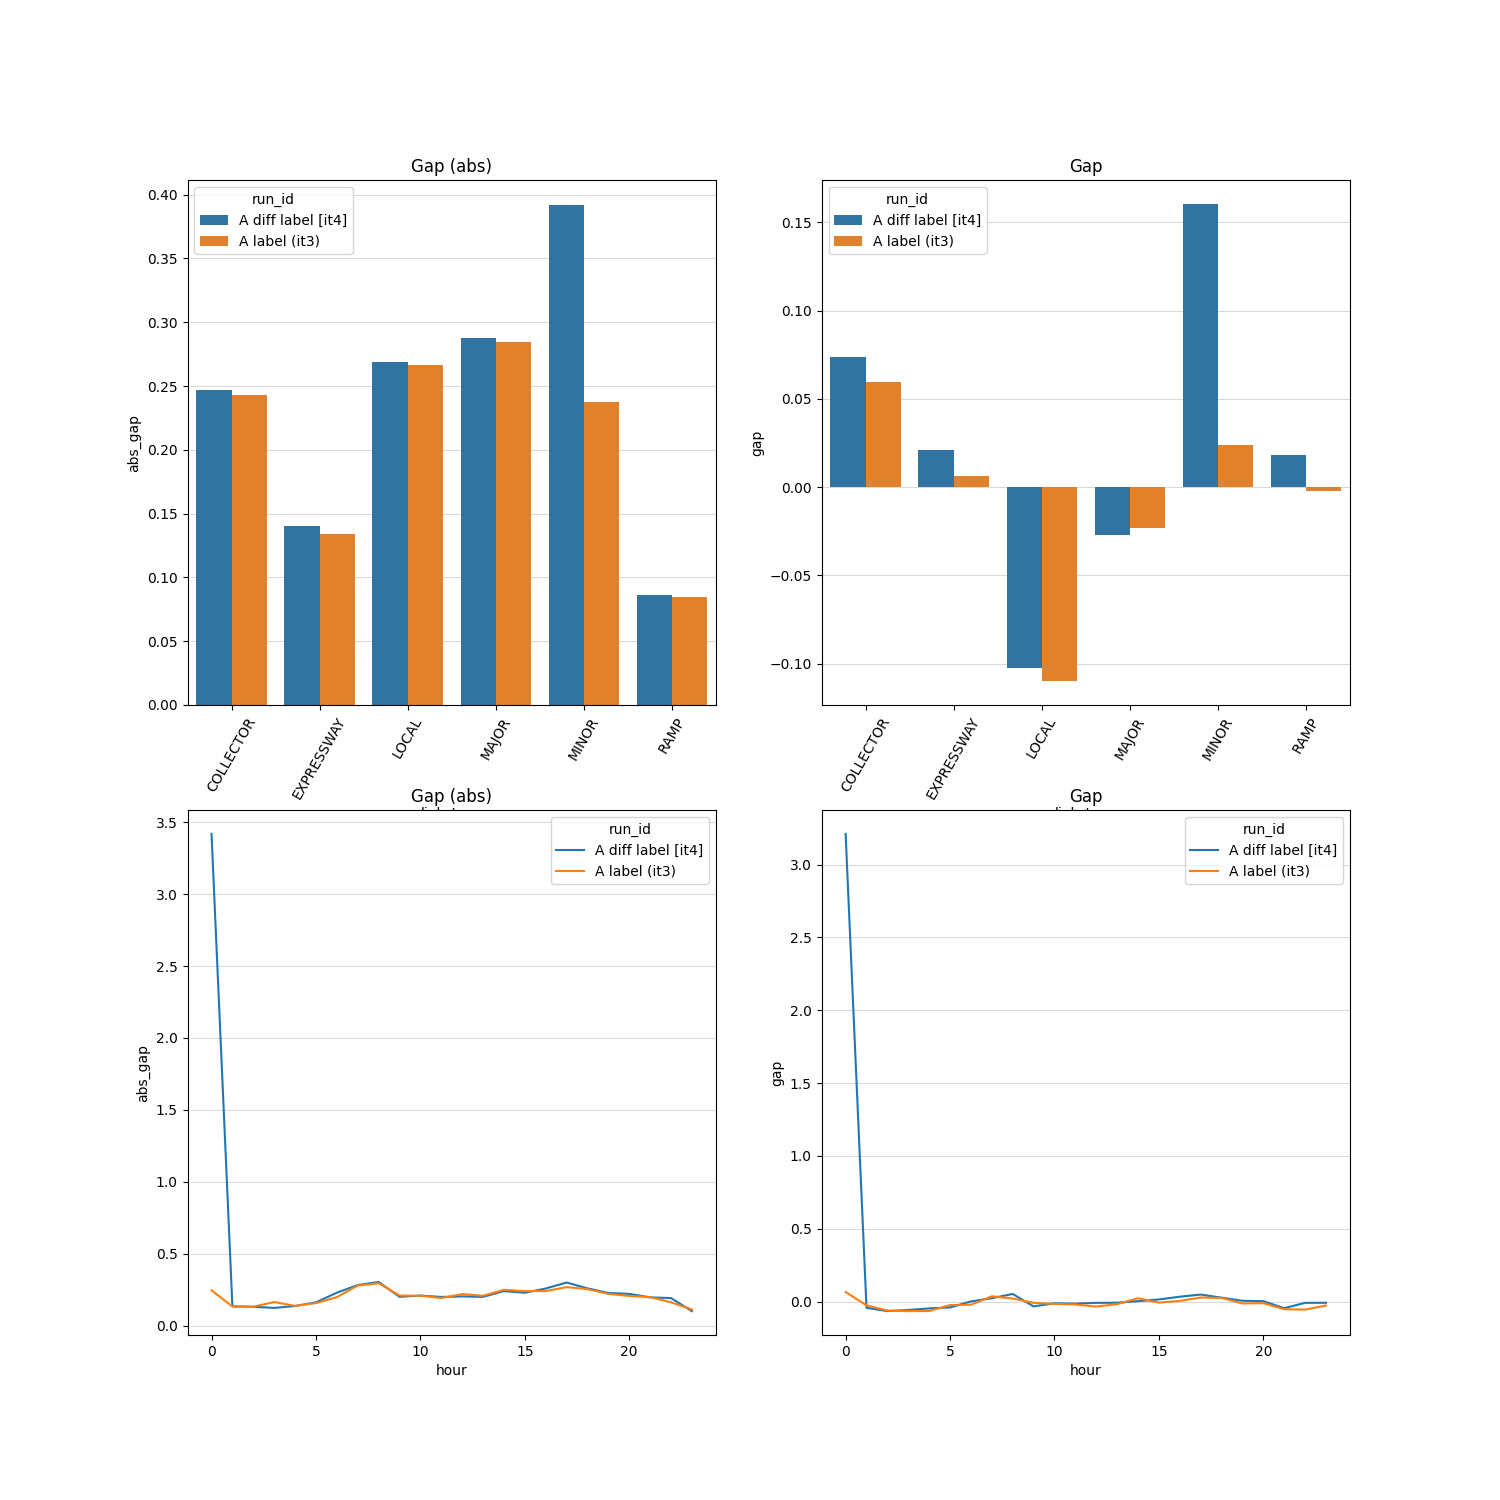
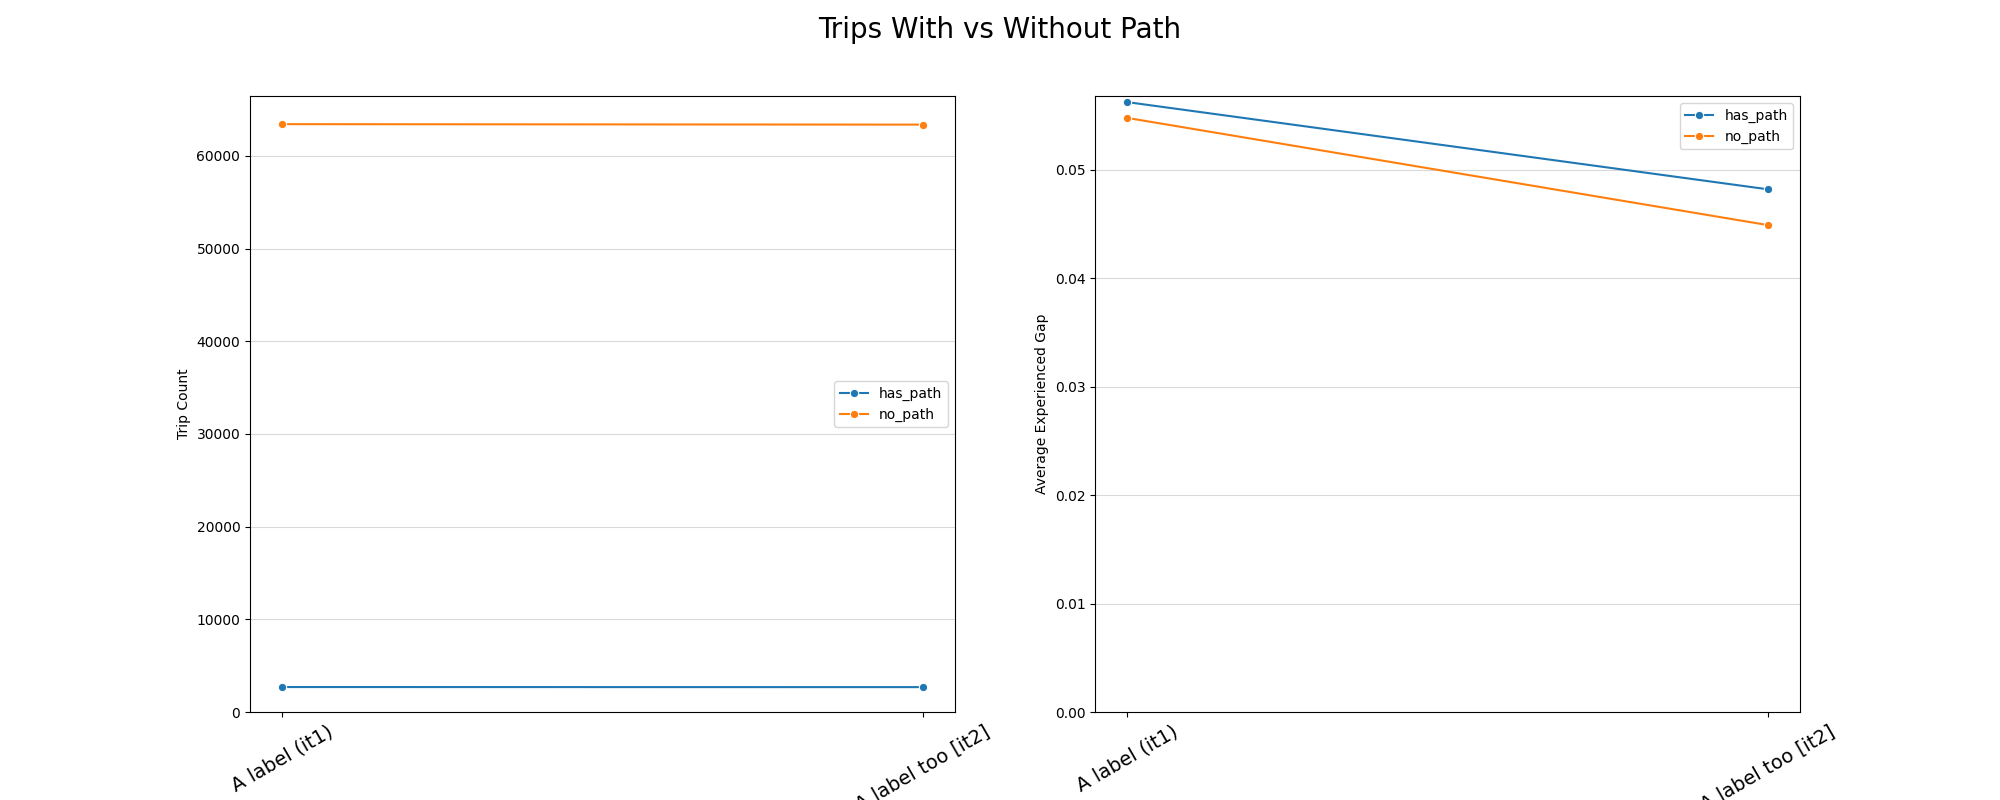
plot_gaps
plot_garage_parking_share
plot_garage_parking_share: failed
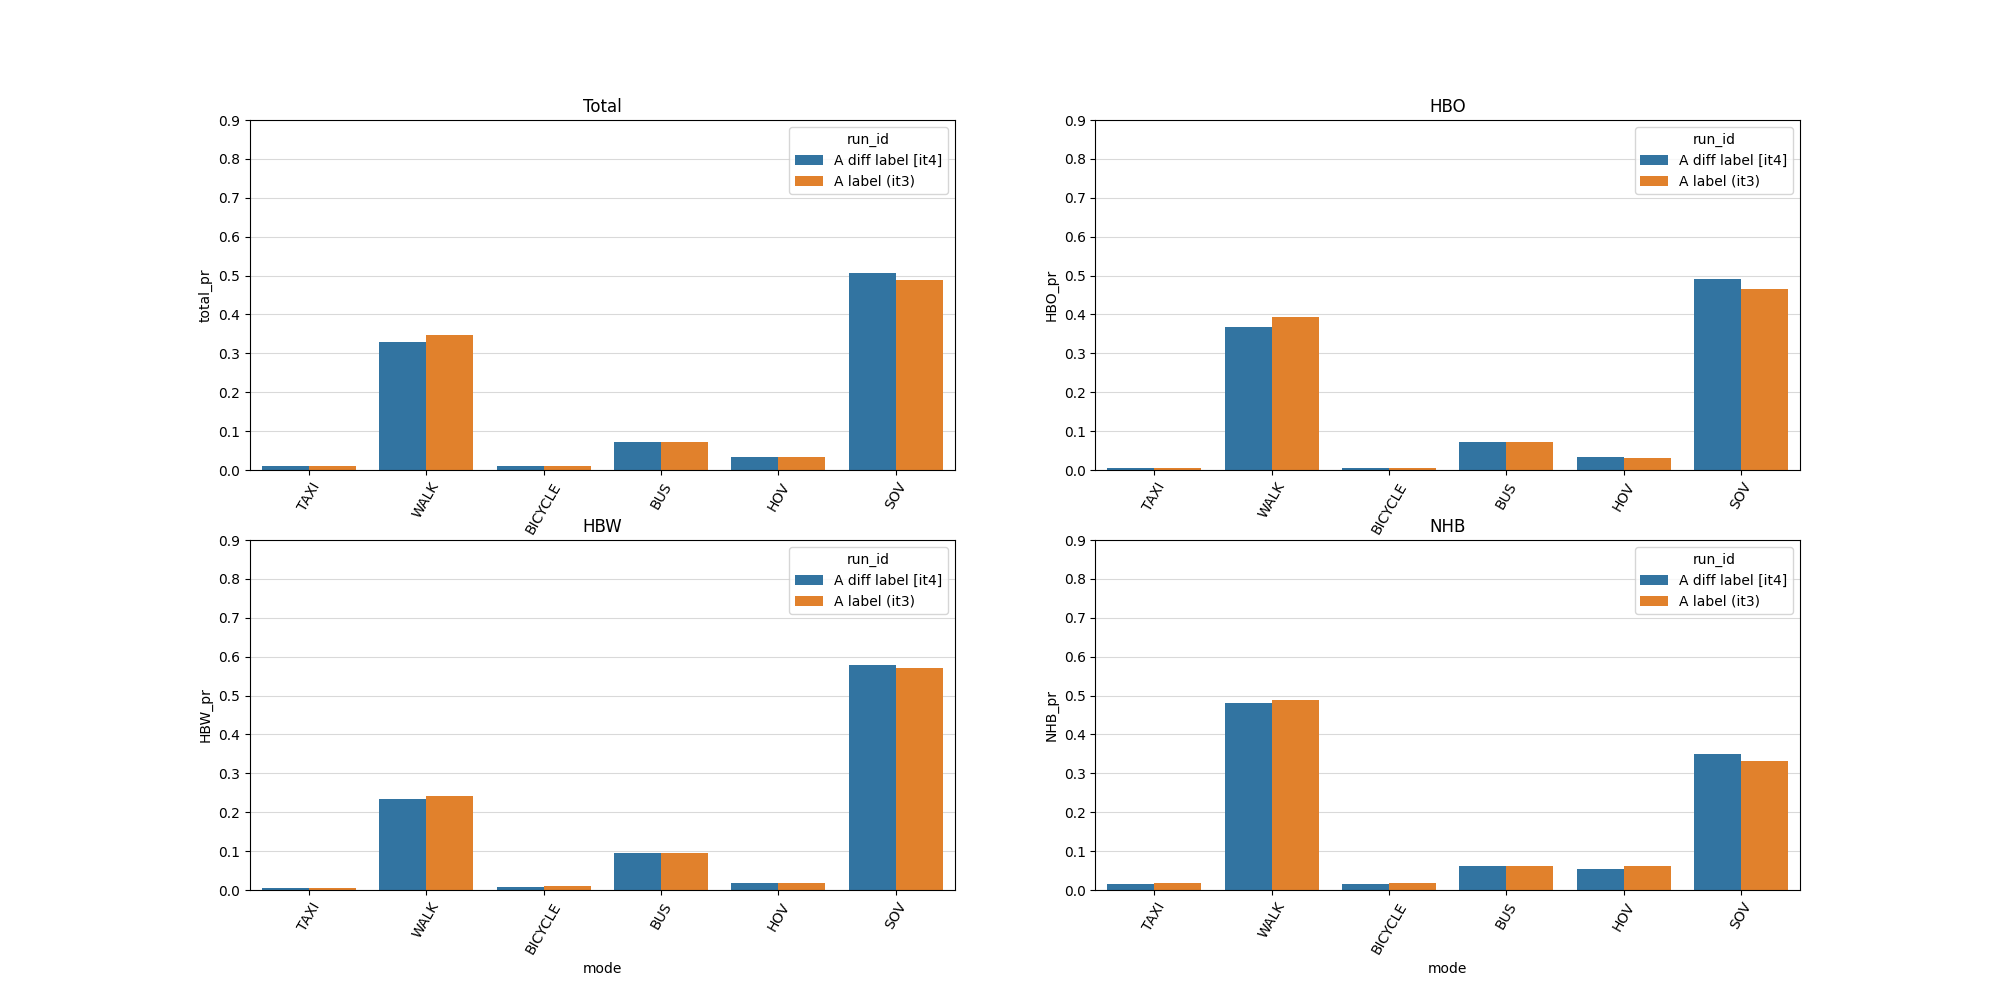
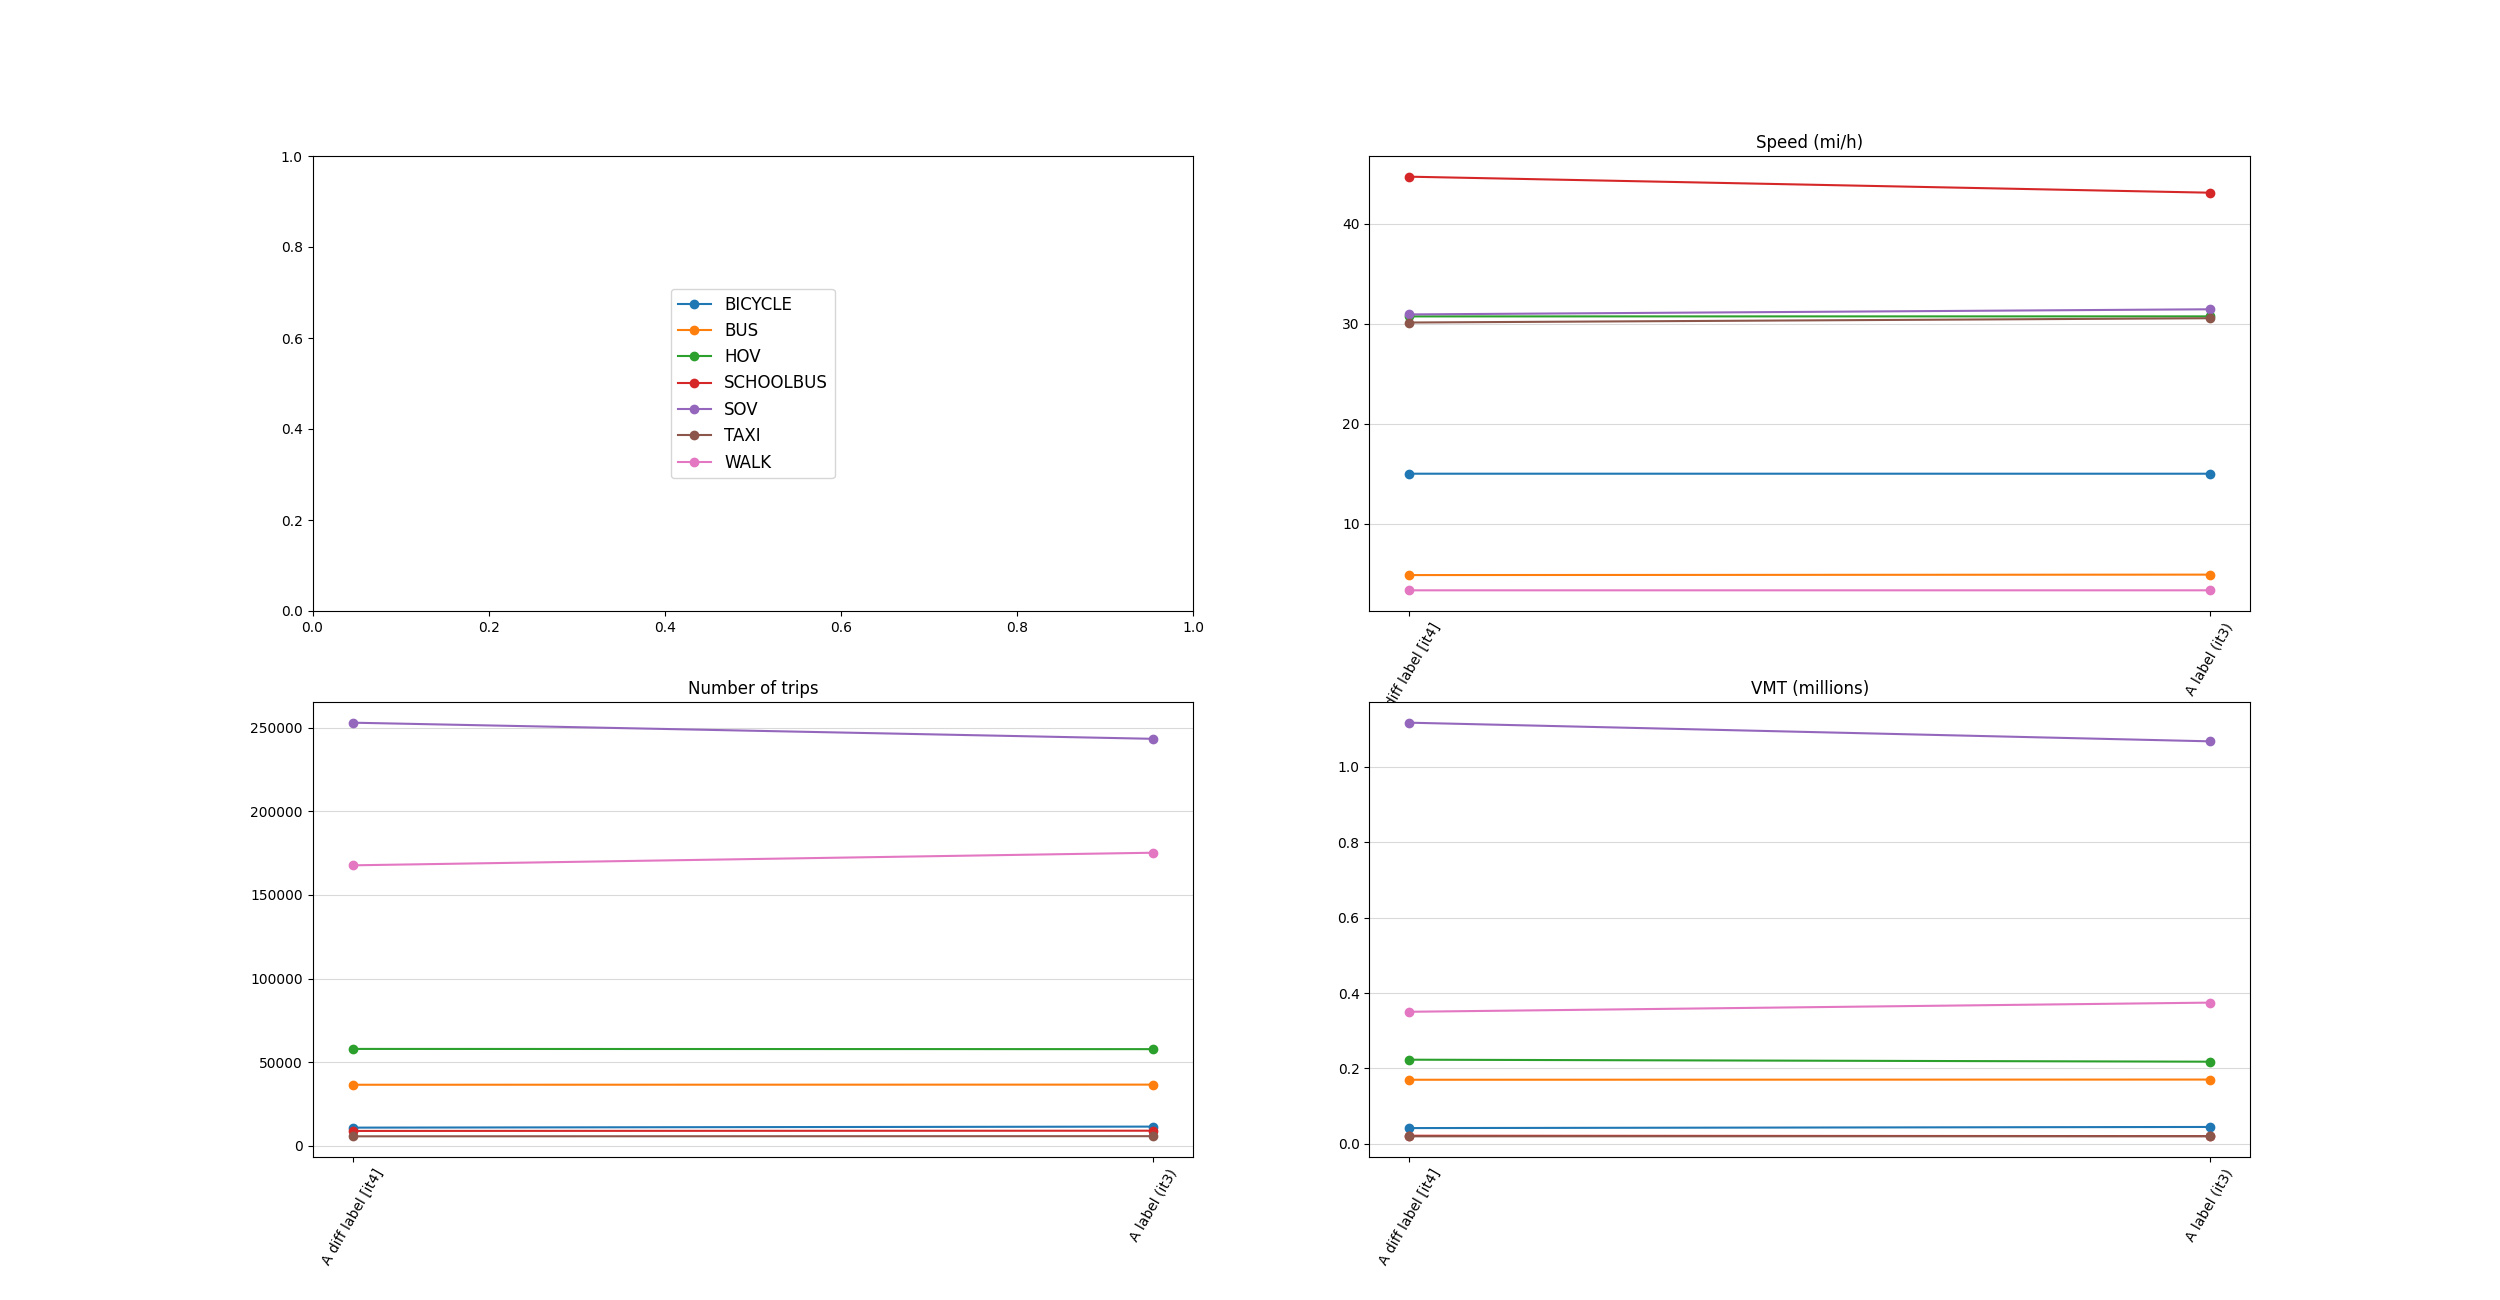
plot_mode_share
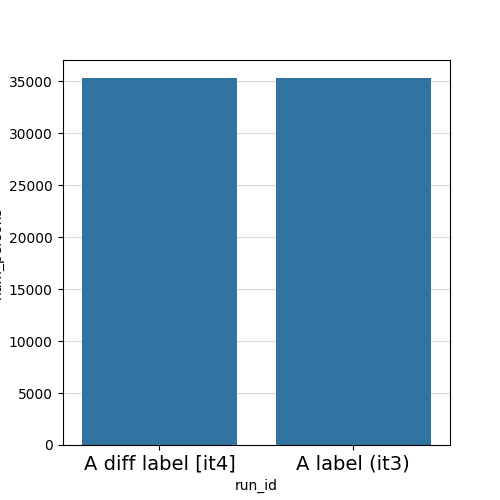
plot_network_gaps
plot_parking_access
plot_parking_delay_stats
plot_parking_demand
plot_parking_revenue
plot_parking_utilization
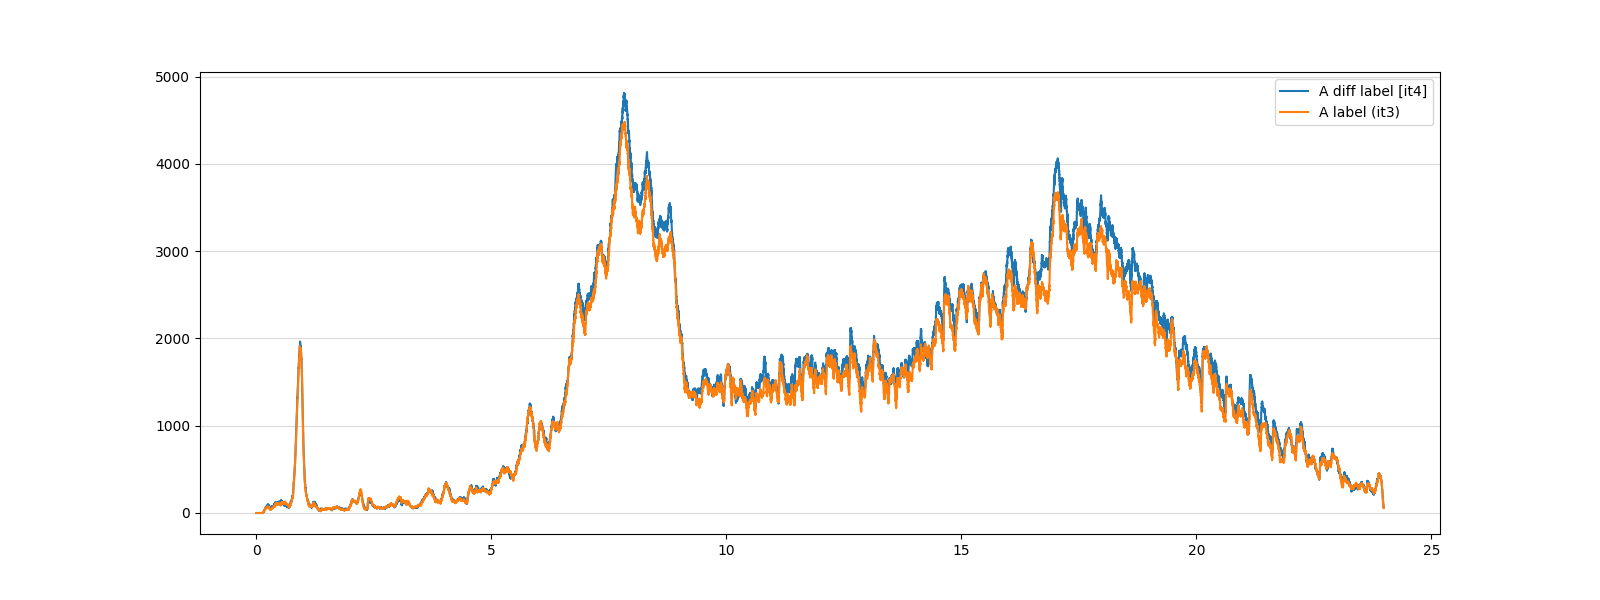
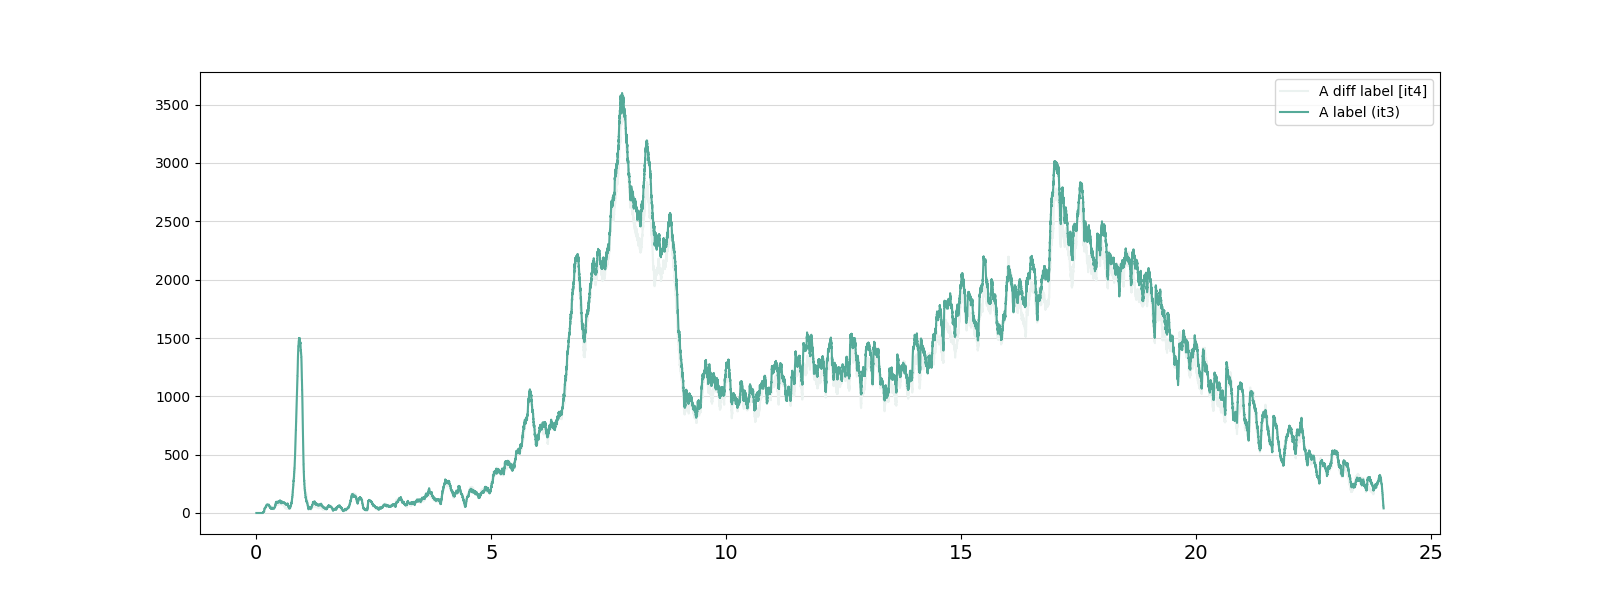
plot_pax_in_network
plot_planned_activity_start_time_distributions
plot_planned_calibration_for_activity_generation_planned
plot_planned_rmse_vs_observed
/home/gitlab-runner/builds/polaris/code/polarislib/polaris/analyze/kpi_comparator.py:1076: RuntimeWarning: More than 20 figures have been opened. Figures created through the pyplot interface (`matplotlib.pyplot.figure`) are retained until explicitly closed and may consume too much memory. (To control this warning, see the rcParam `figure.max_open_warning`). Consider using `matplotlib.pyplot.close()`.
fig, axes = plt.subplots(nrows=1, ncols=len(things), figsize=(20, 8), sharey=True)
plot_polaris_exe
<IPython.core.display.HTML object>
<pandas.io.formats.style.Styler object at 0x7a128eb5aea0>
plot_population
plot_rmse_vs_observed
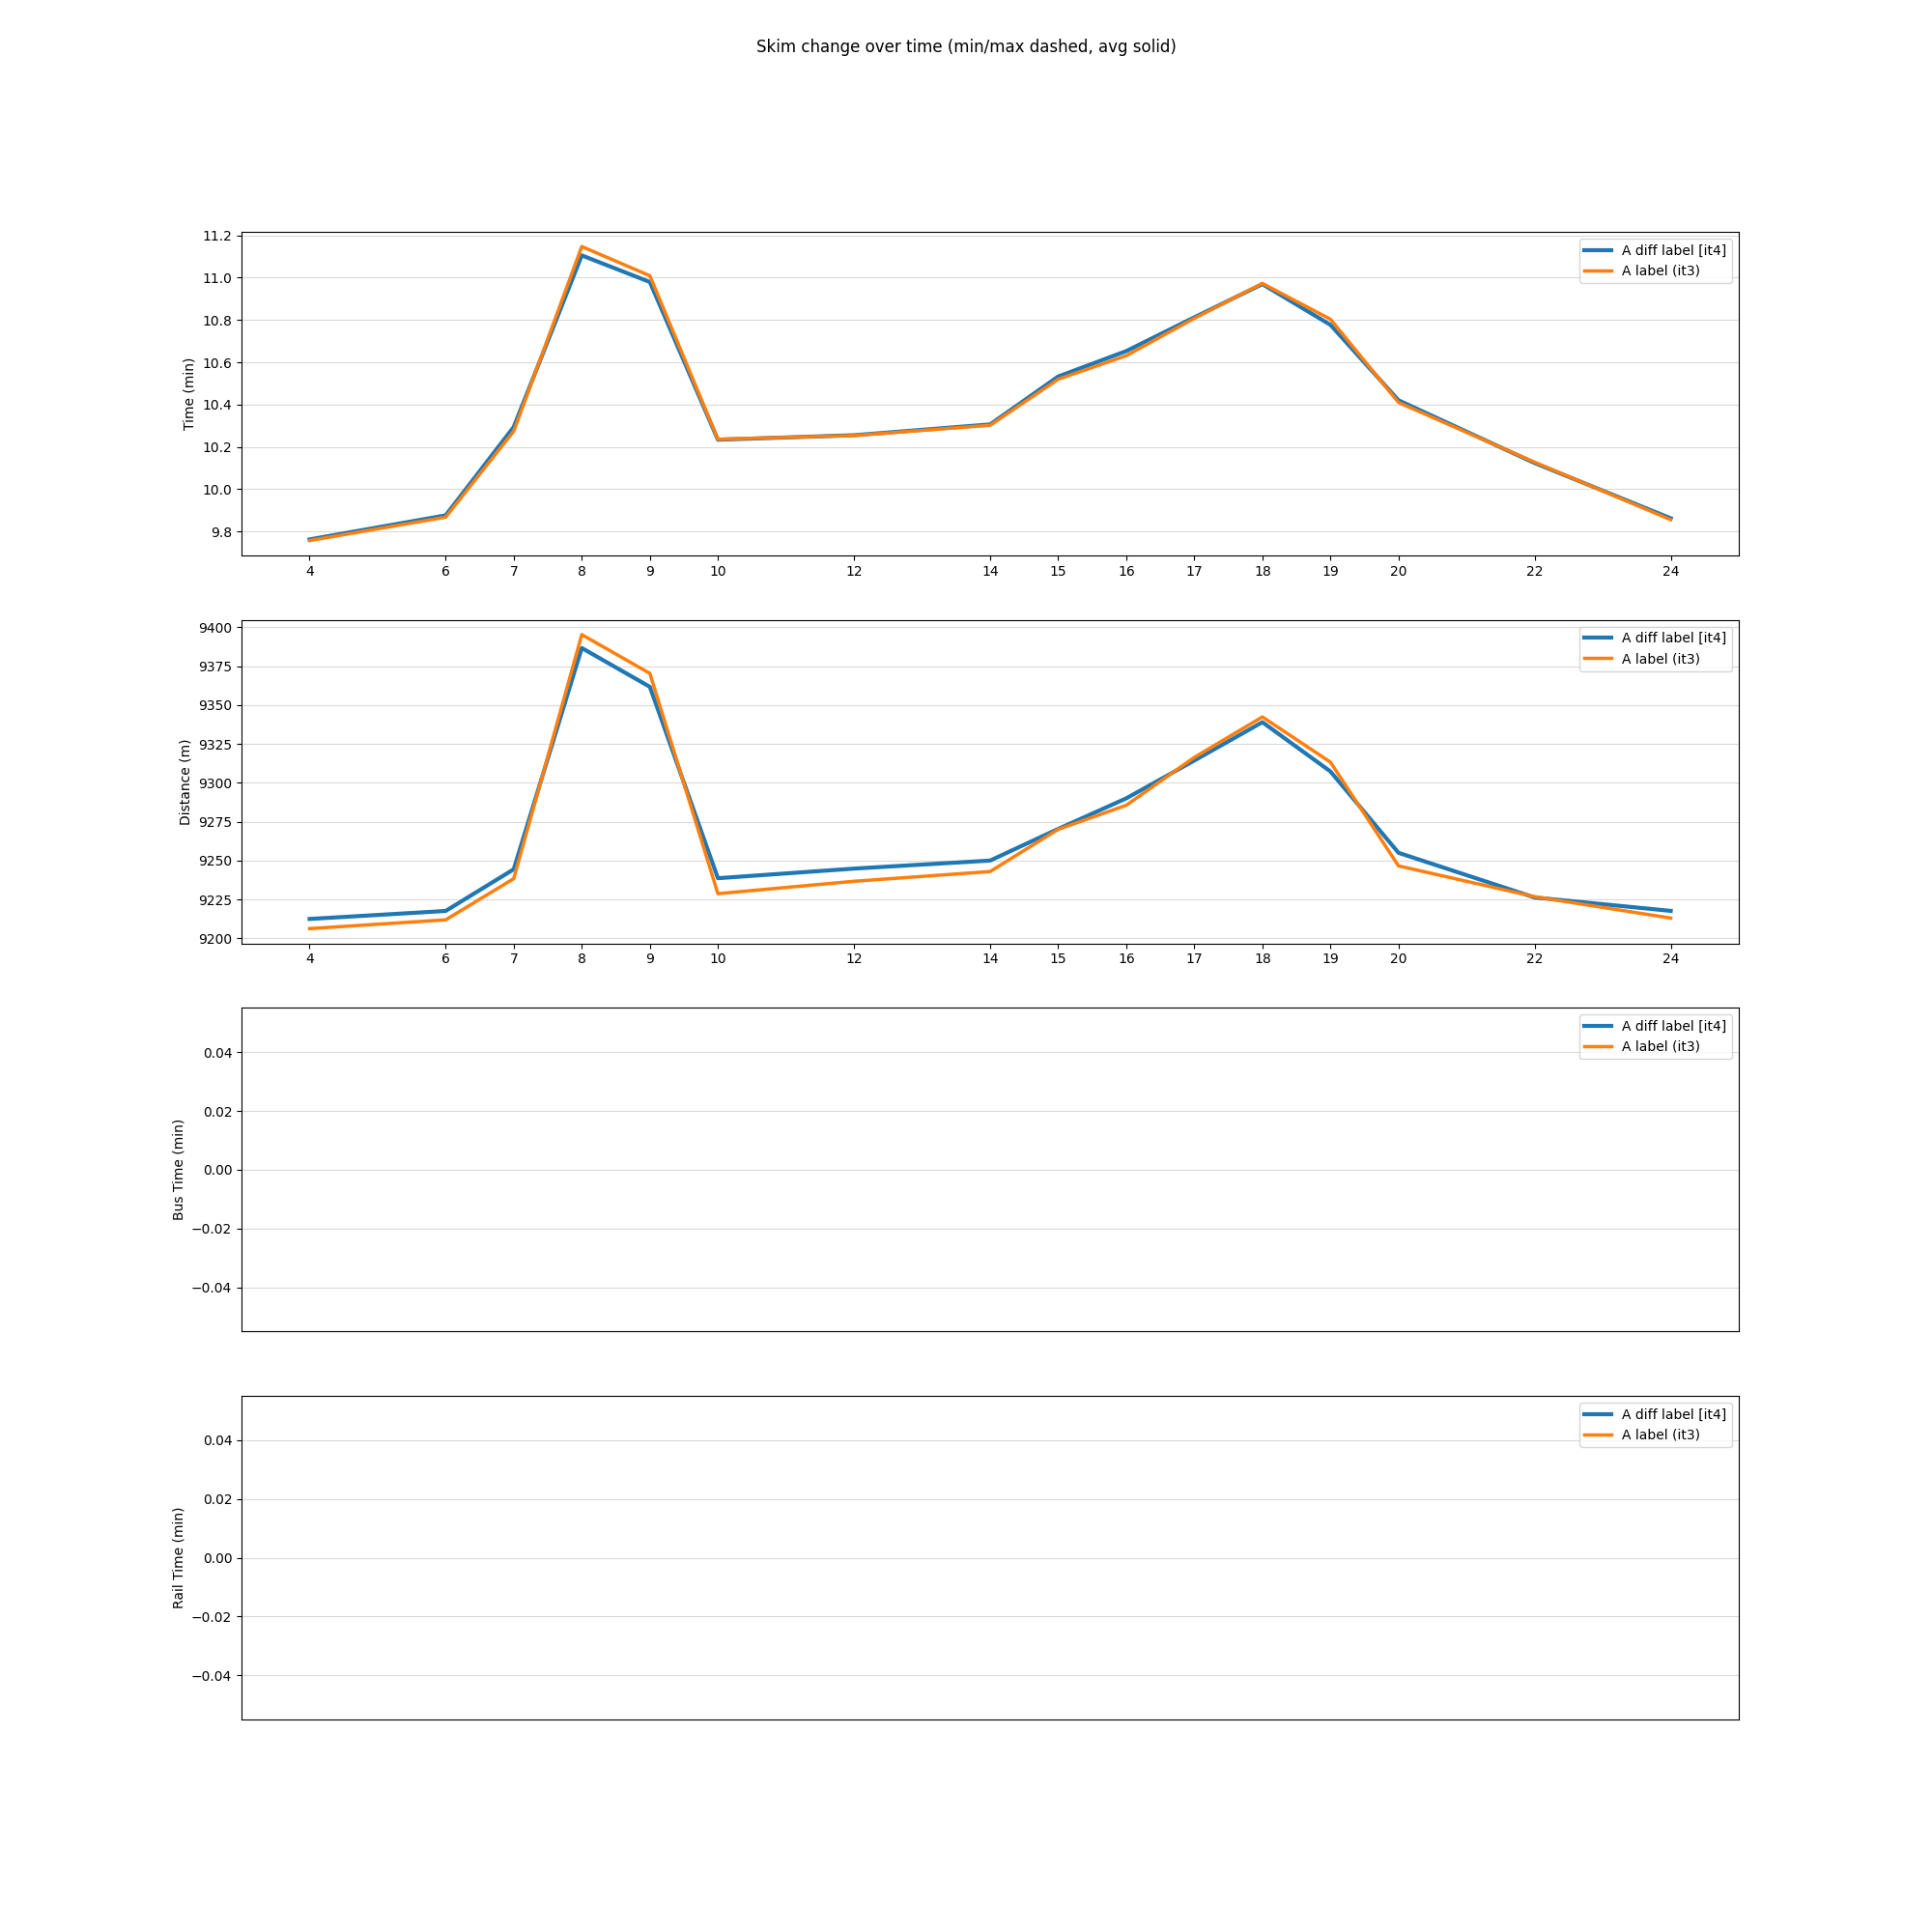
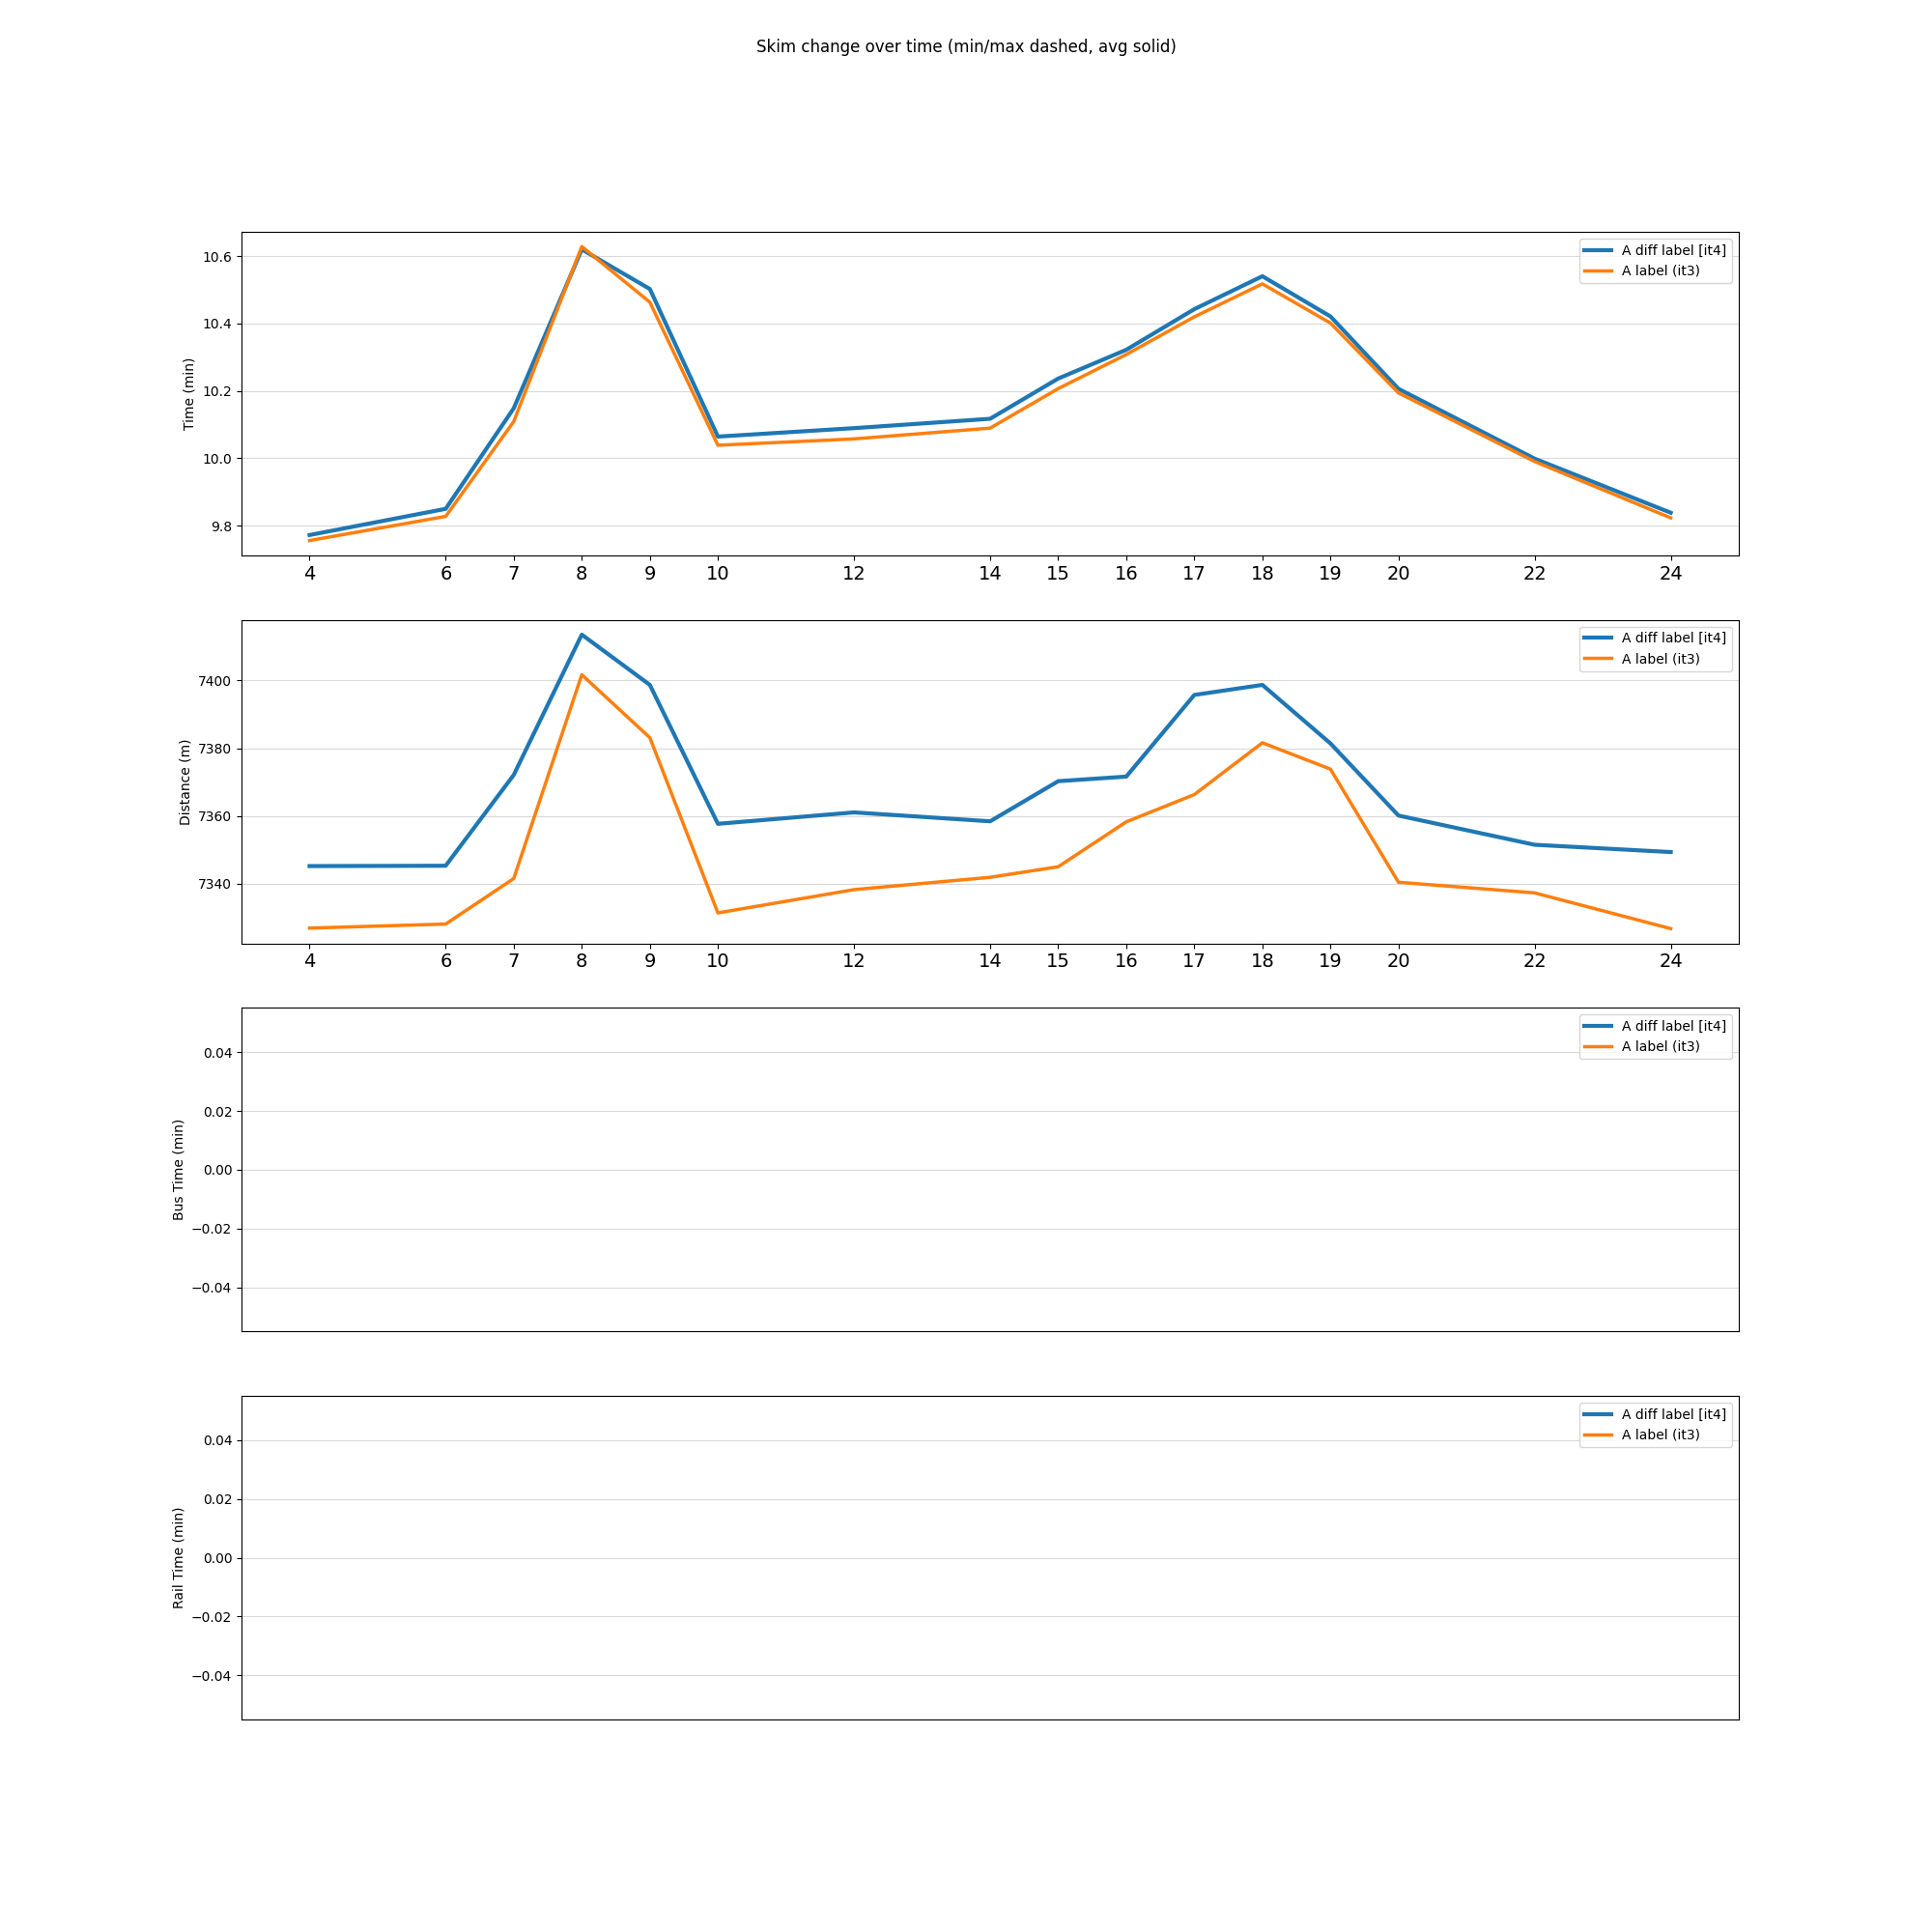
plot_skim_stats
/home/gitlab-runner/builds/polaris/code/polarislib/polaris/analyze/result_kpis.py:974: RuntimeWarning: Mean of empty slice
"avg": np.nanmean(mat[isfinite_mask]),
/home/gitlab-runner/builds/polaris/code/polarislib/polaris/analyze/result_kpis.py:974: RuntimeWarning: Mean of empty slice
"avg": np.nanmean(mat[isfinite_mask]),
plot_tnc_demand
plot_tnc_demand: failed
plot_tnc_stats
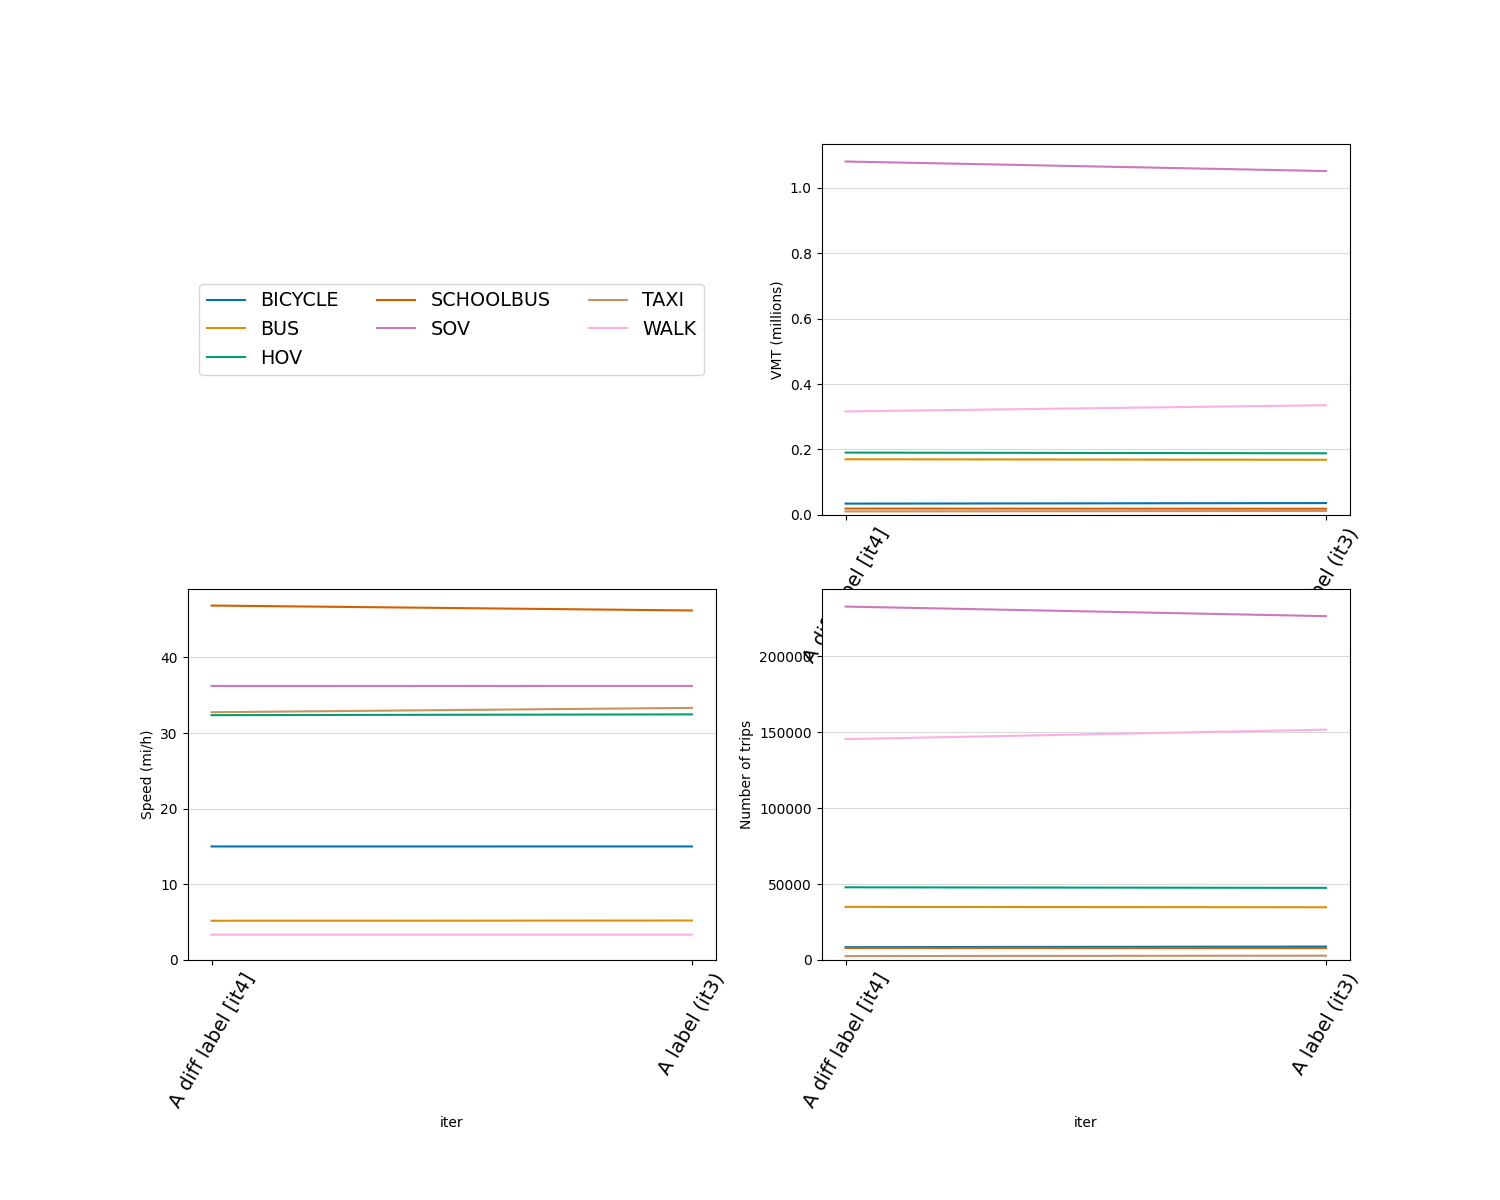
plot_tnc_vmt_vht
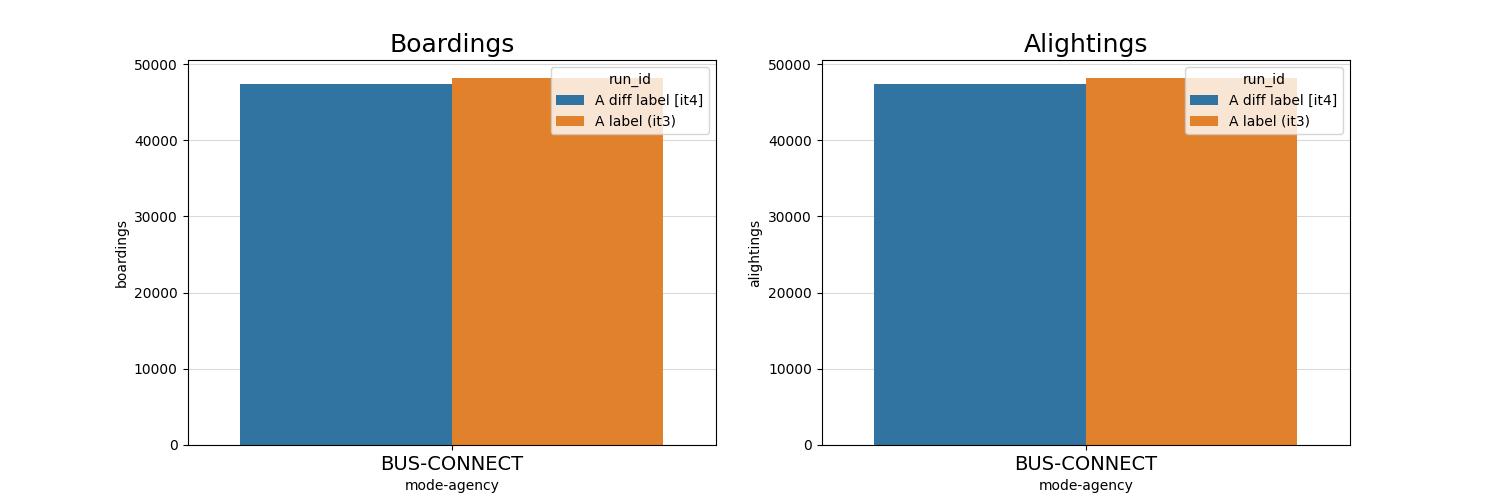
plot_transit
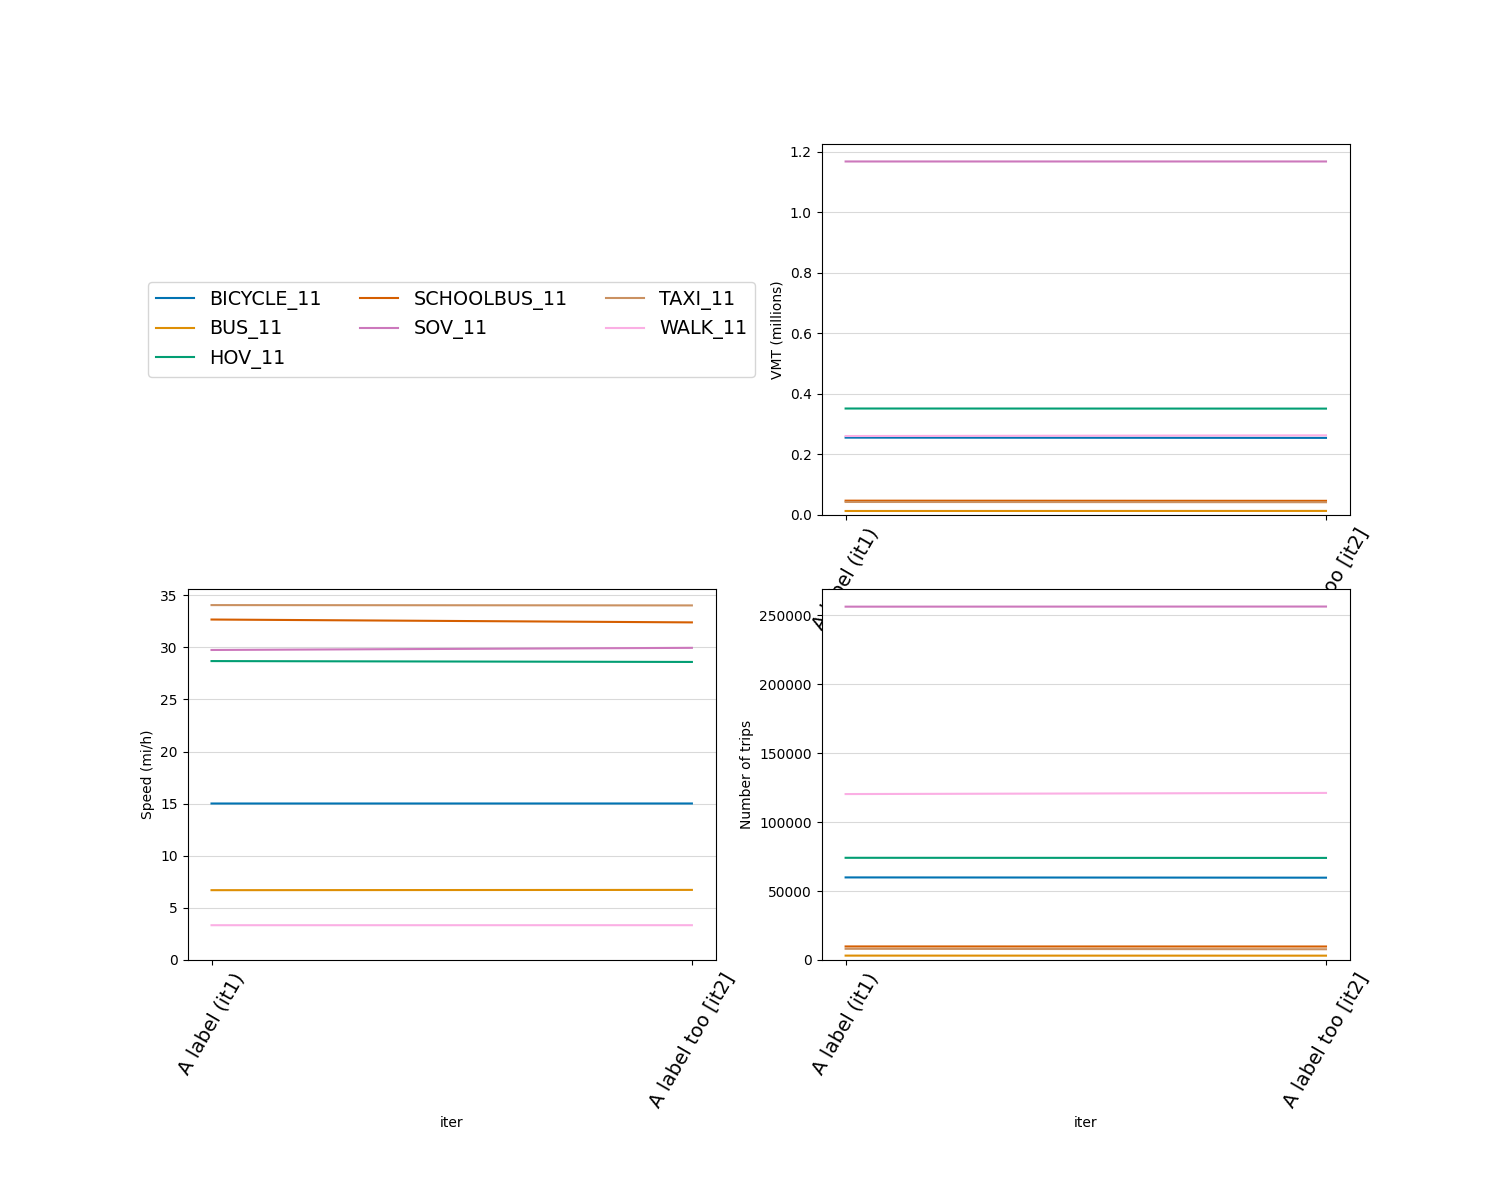
plot_trip_count_by_attributes
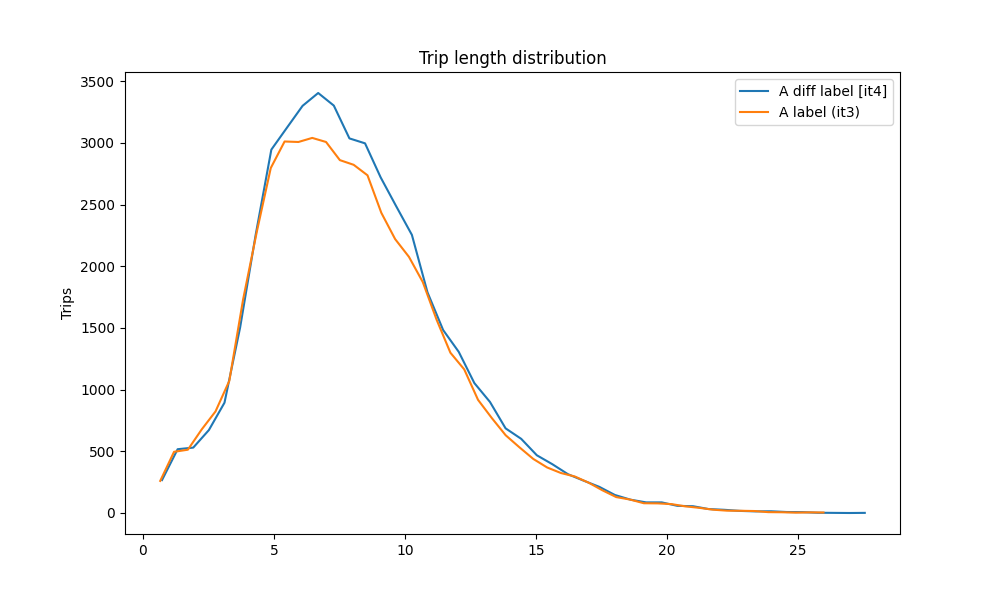
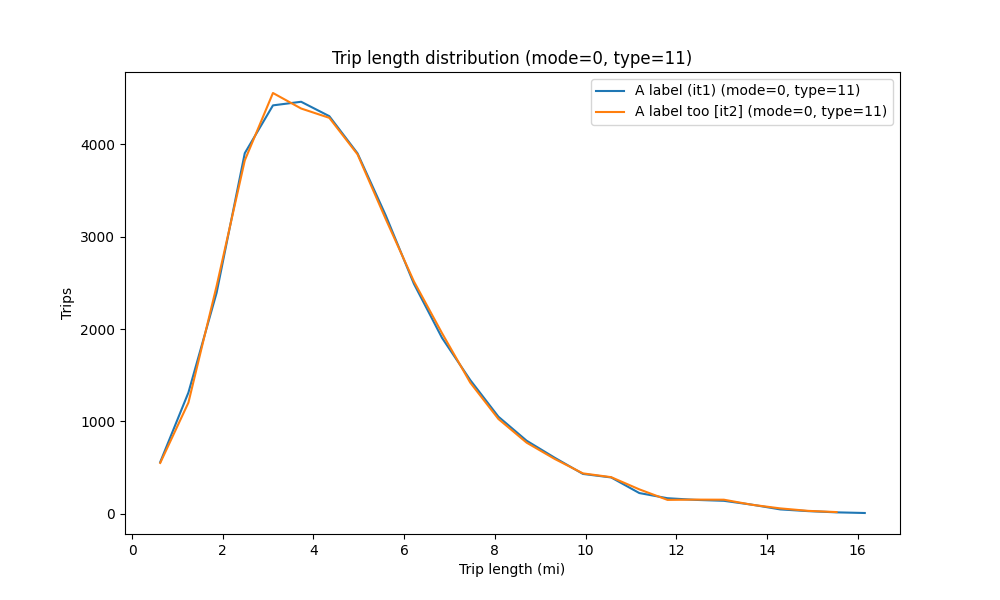
plot_trip_length_distributions
plot_trip_length_distributions: failed
plot_trips_with_path
plot_truck_vht_by_mode_trade_type
plot_truck_vmt_by_mode_trade_type
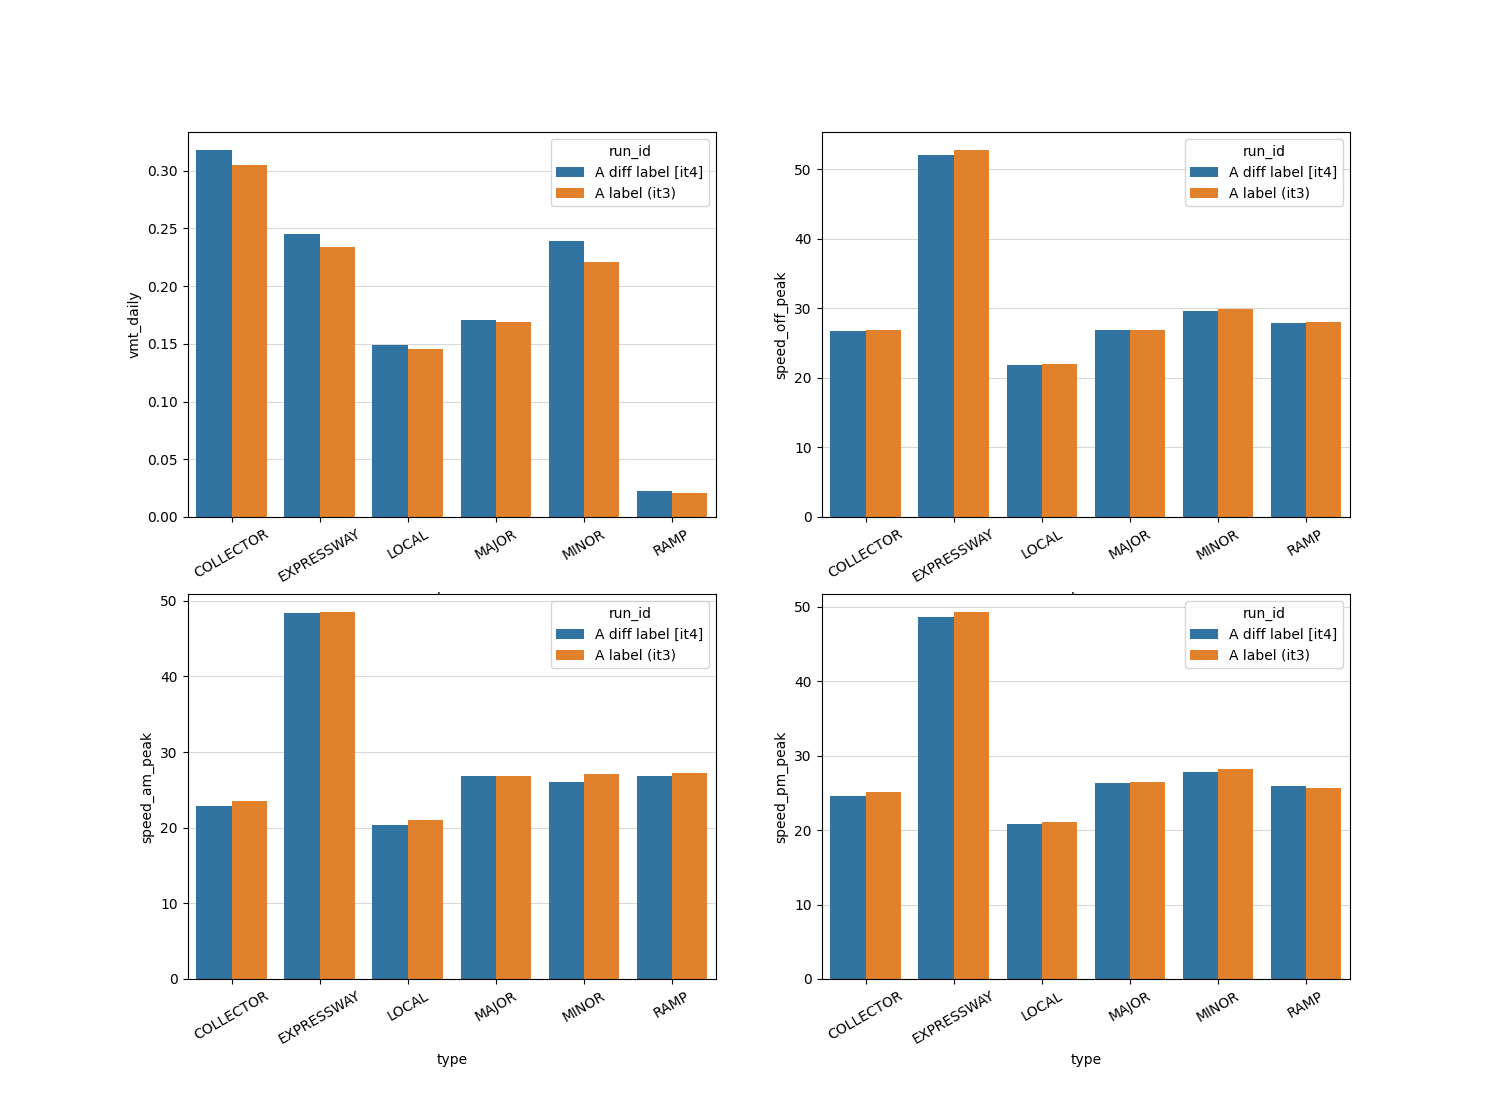
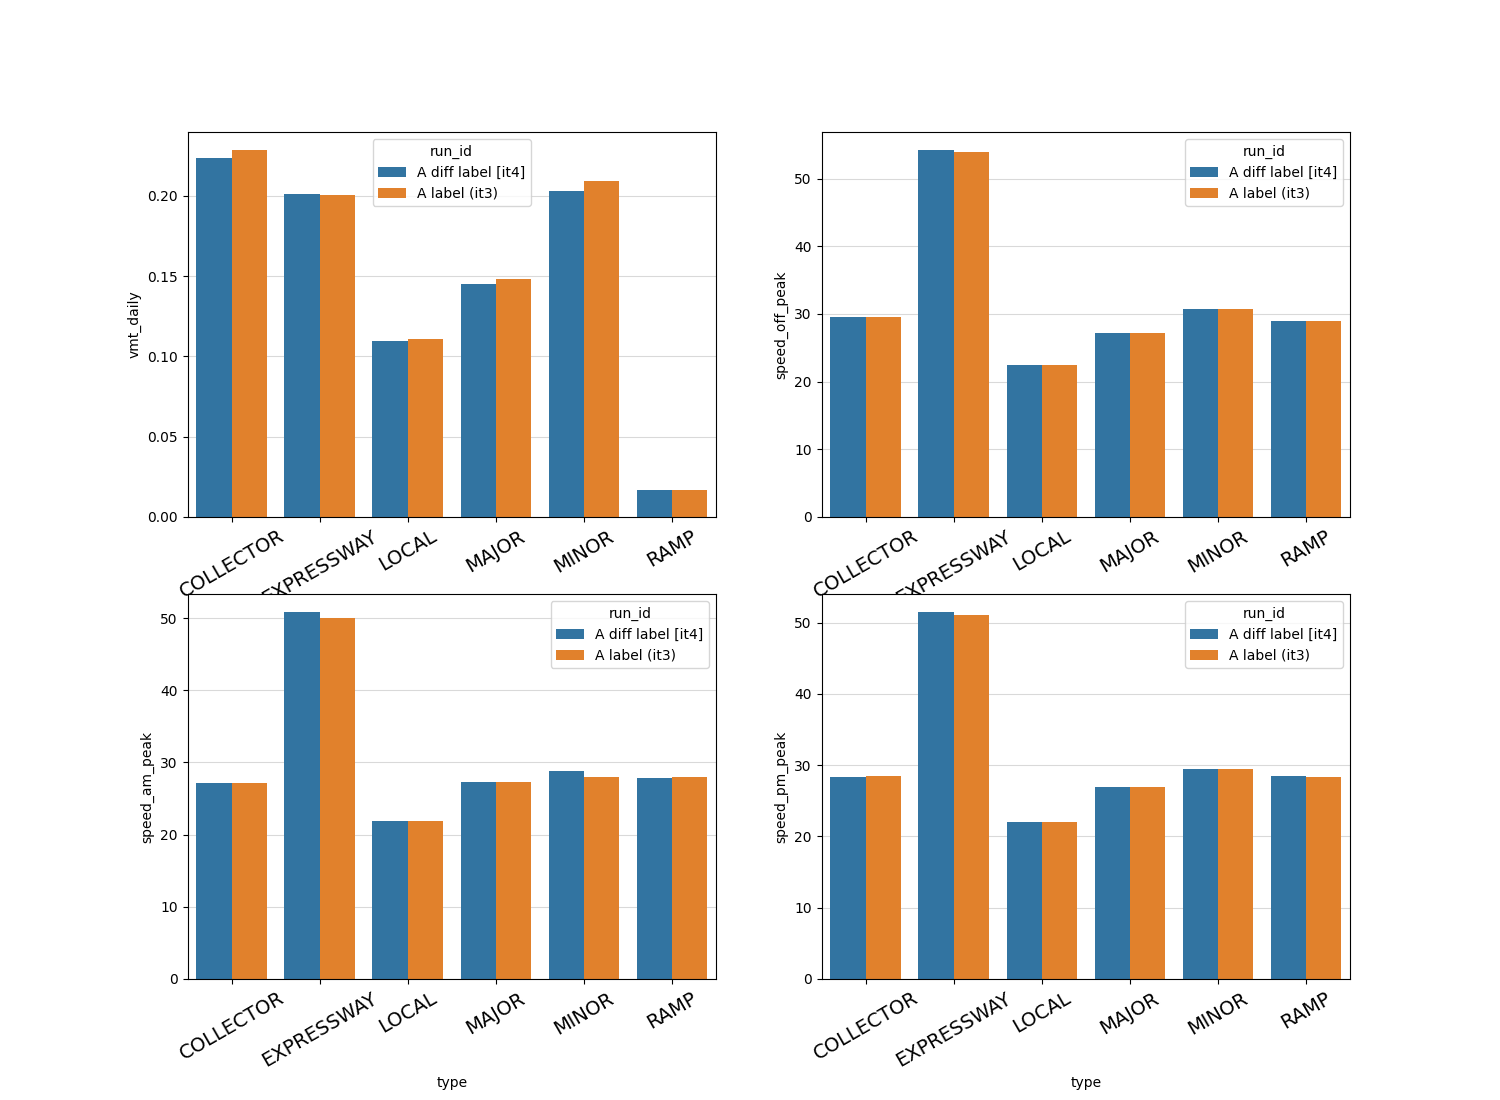
plot_validation_for_speeds
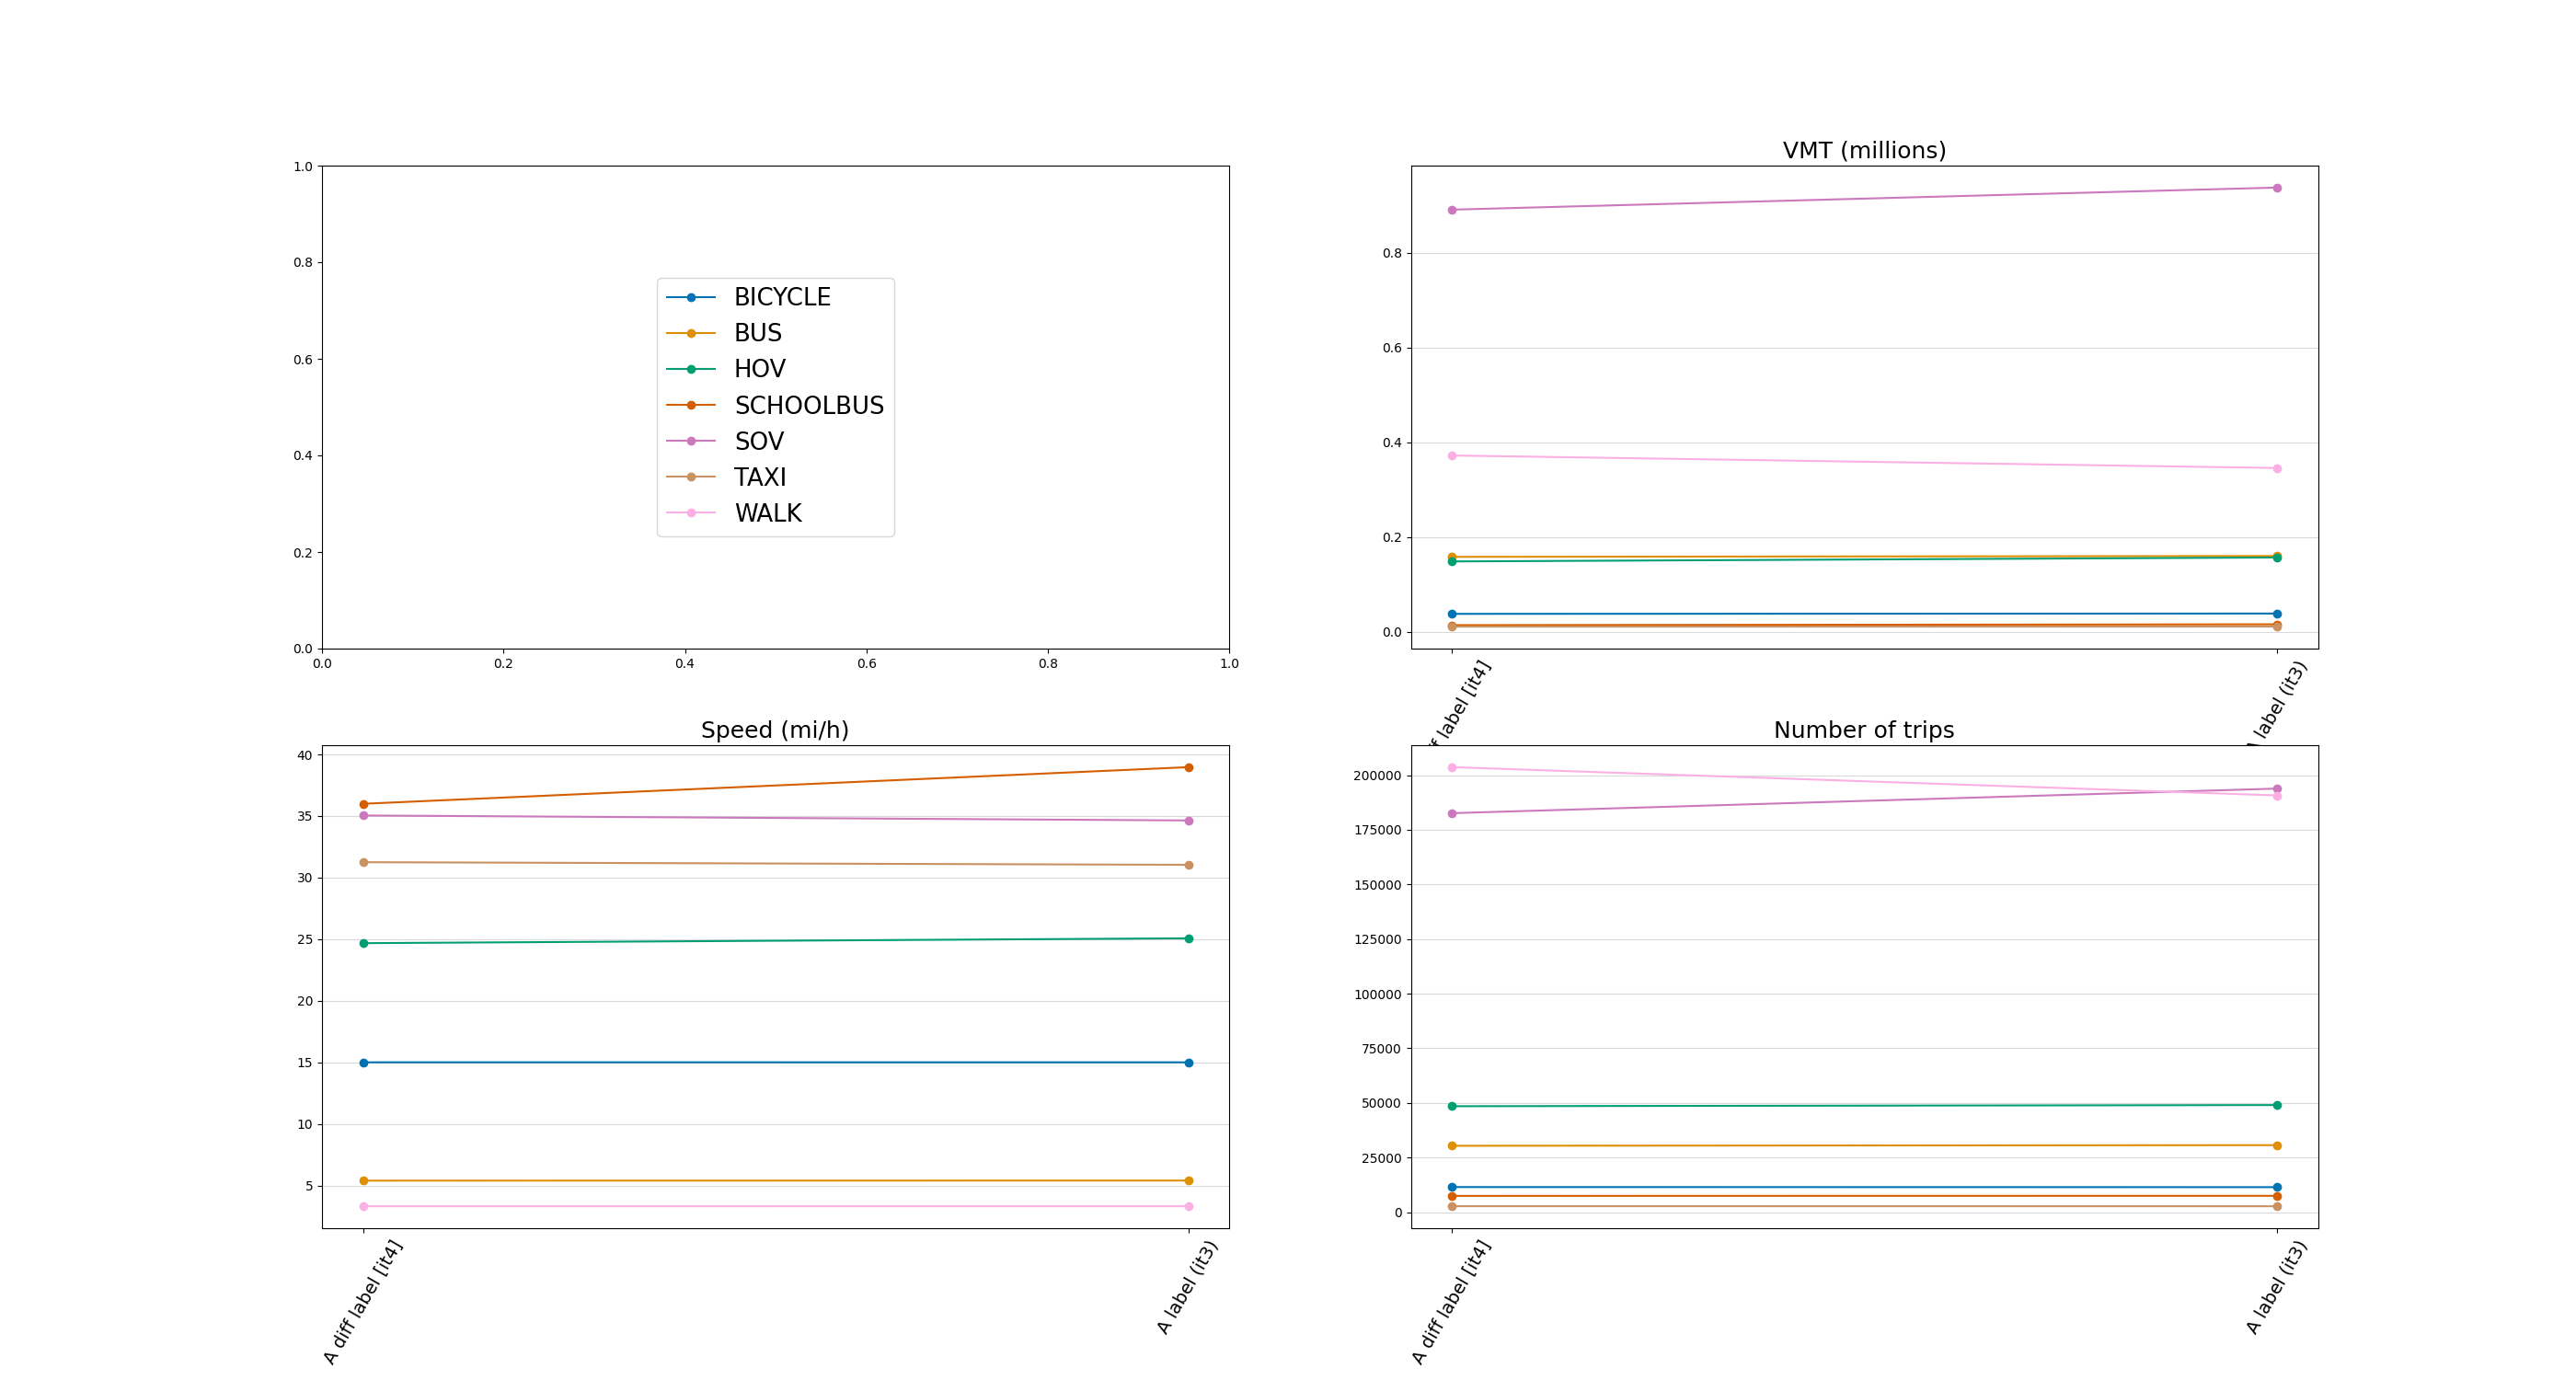
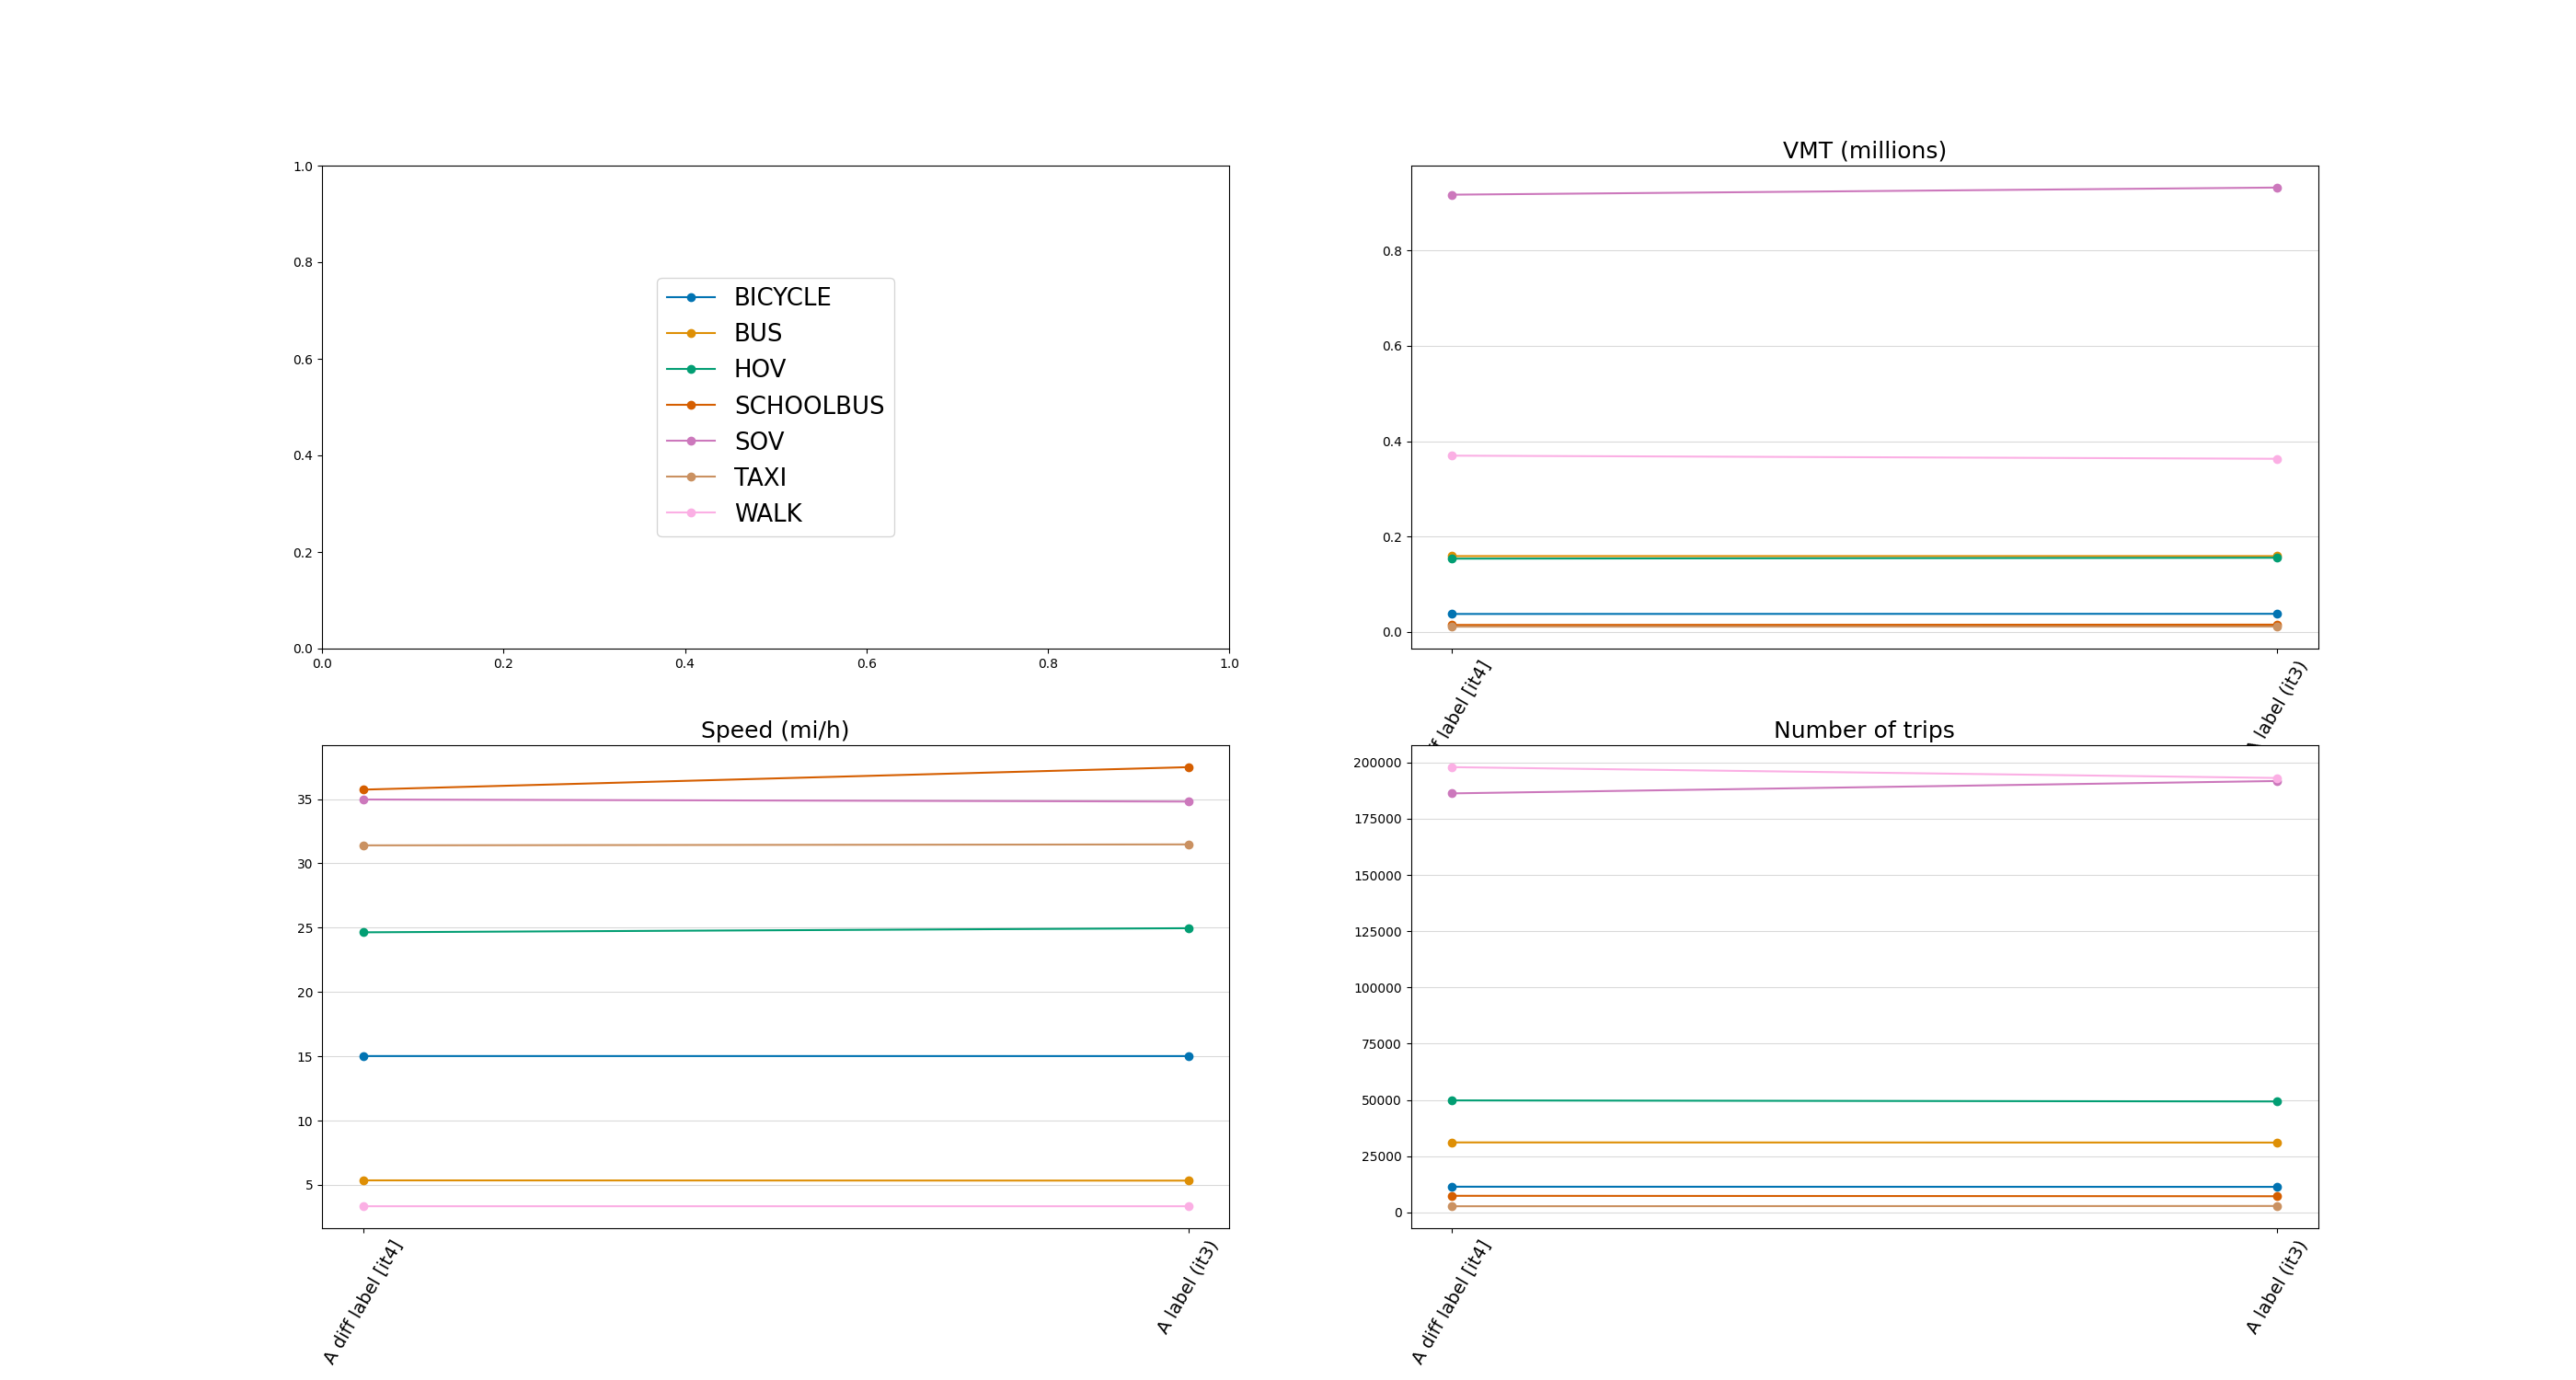
plot_veh_in_network
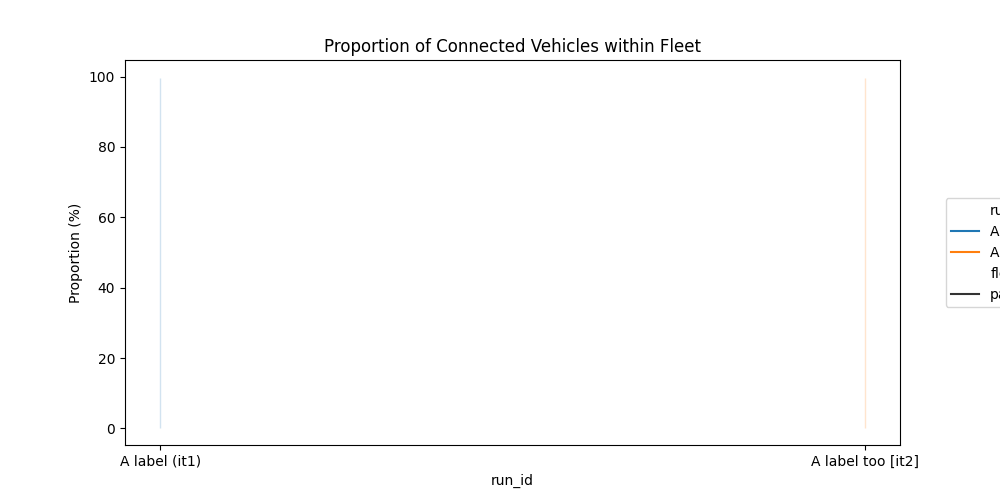
plot_vehicle_connectivity
plot_vmt
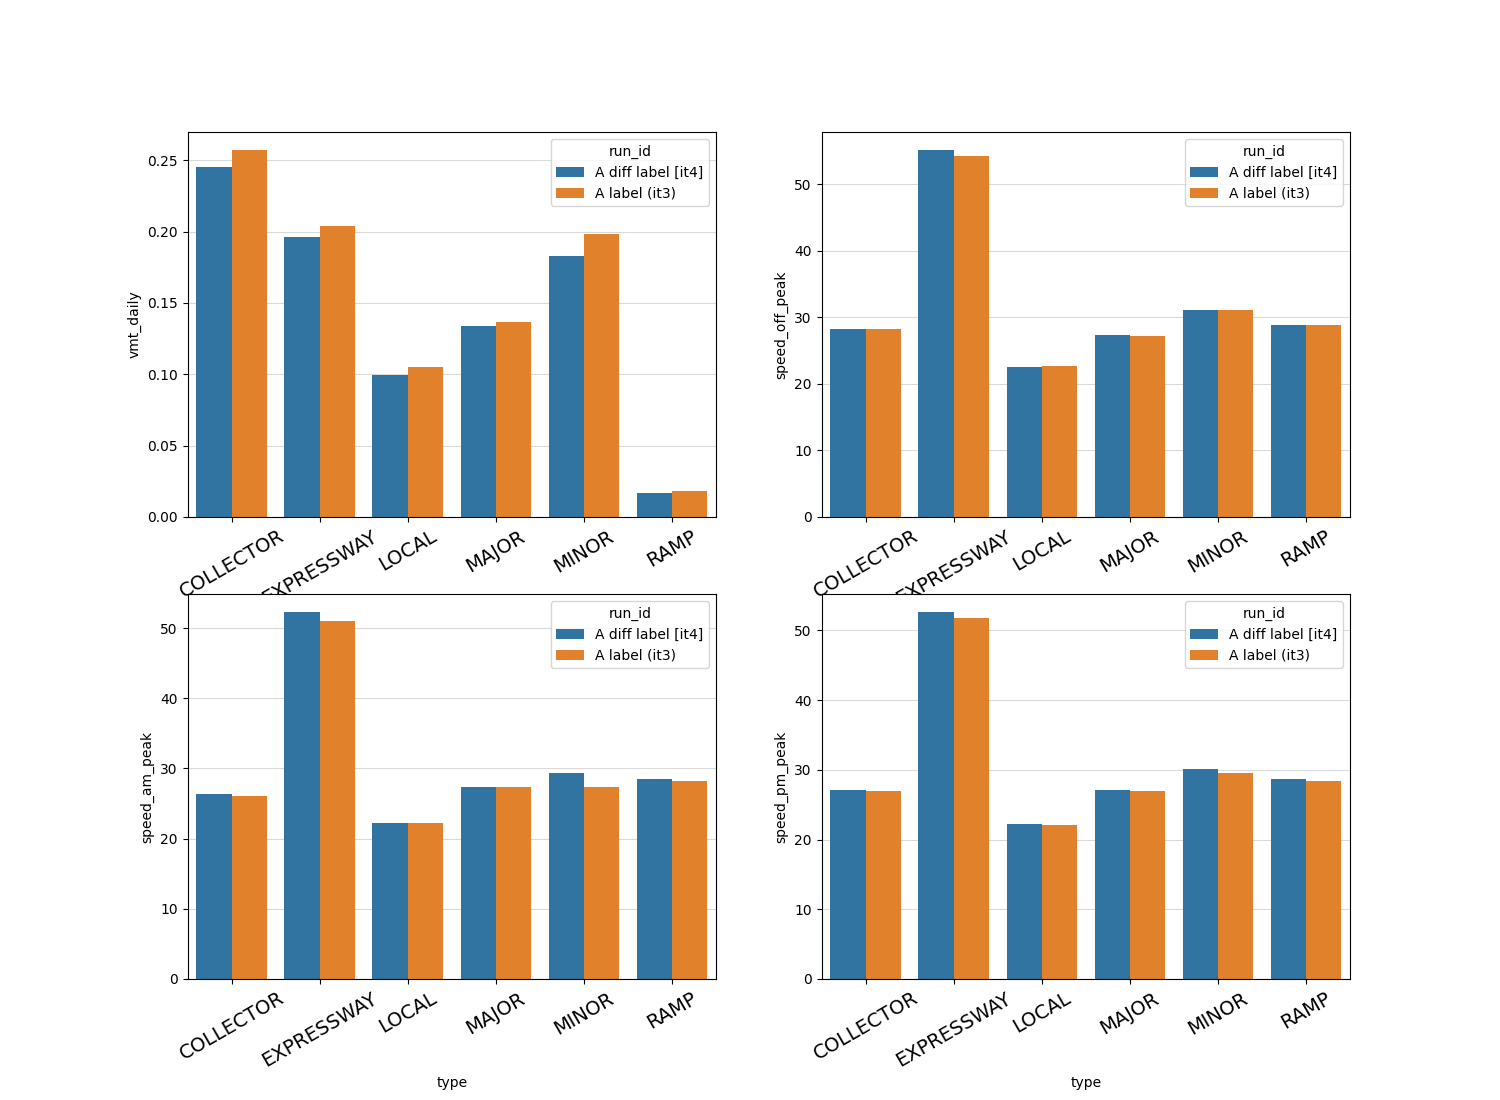
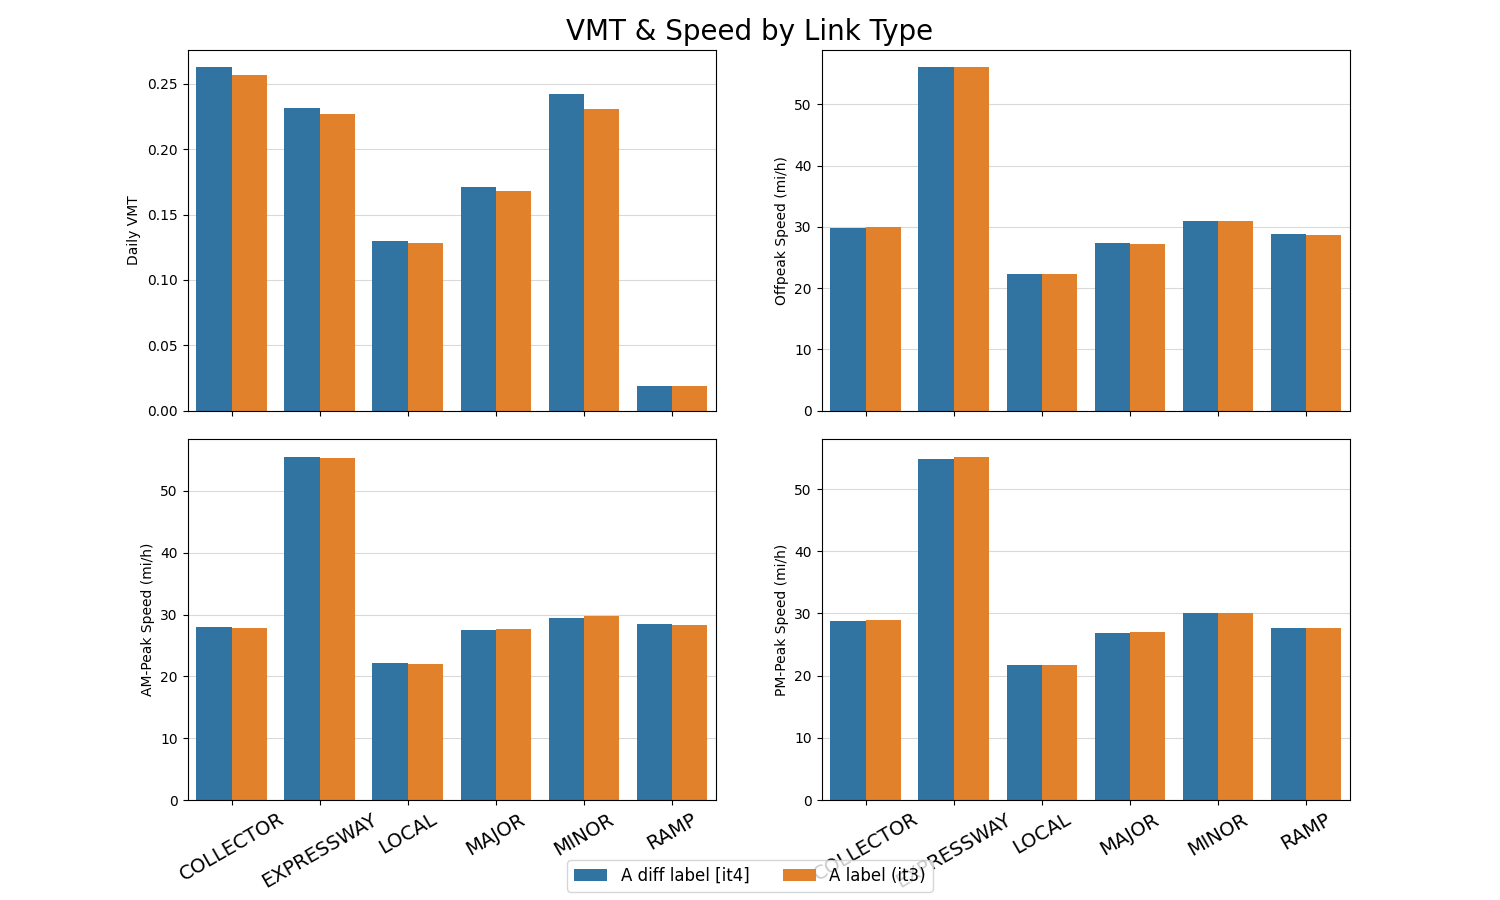
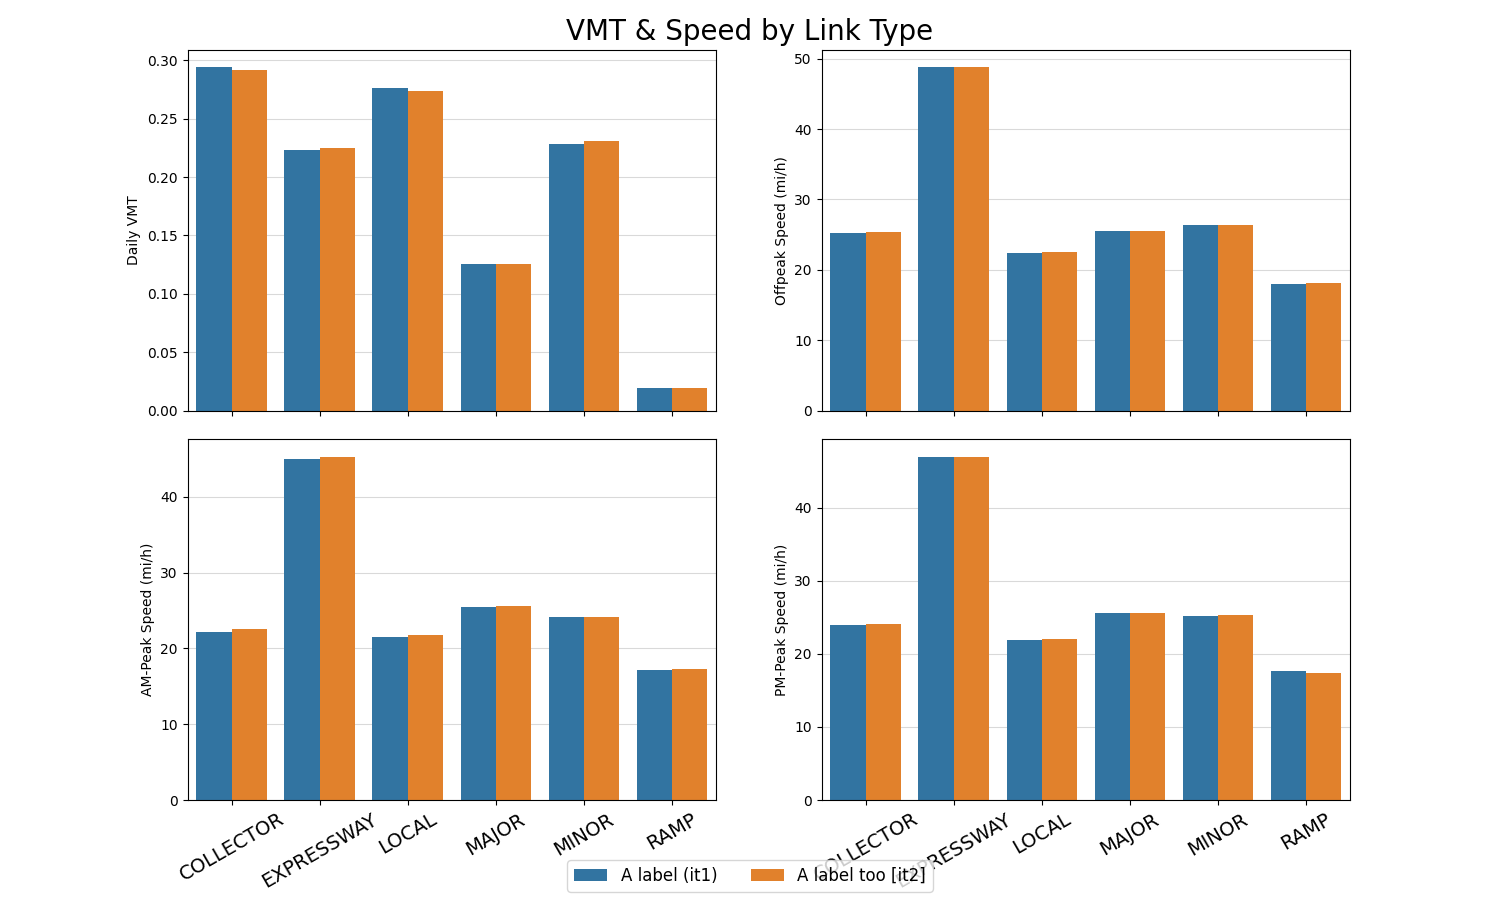
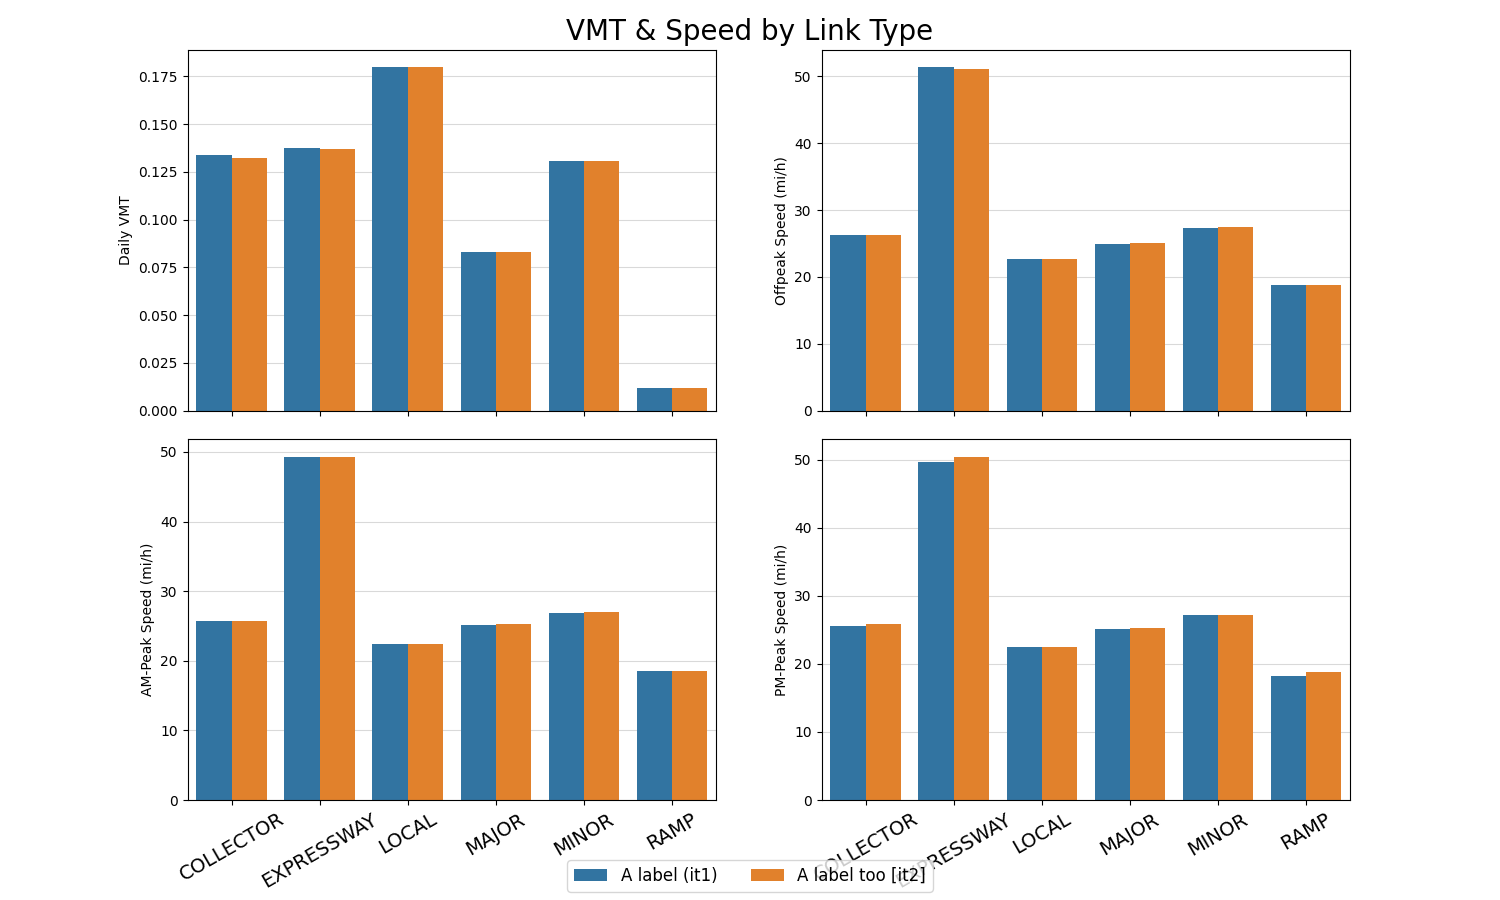
plot_vmt_by_link_type
Total running time of the script: (0 minutes 46.061 seconds)