Note
Go to the end to download the full example code.
Guided creation of a new model from scratch#
On this example, we show how to use Polaris-Studio tools to start the creation of the most complicated portions of the supply models, including:
Network from OpenStreetMaps
EV Charger locations from NREL
Zoning system from the Census
Transit routes from GTFS provided by MobilityData (if available)
Many of these steps require API keys, which are not provided by Polaris-Studio. The user will need to obtain them from the respective providers. For the purpose of this example, API keys are obtained from the environment variables CENSUS_API_KEY, MOBILITY_DATABASE_API_KEY & EV_API_KEY.
WARNING
The automated build process is not capable of building a model that is ready for simulation, but it is rather designed solely to get you most of the way there.
Imports#
import os
from pathlib import Path
from tempfile import gettempdir

import geopandas as gpd

from polaris.network.network import Network
sphinx_gallery_thumbnail_path = ‘../../examples/model_building/model_from_scratch.png’
# We define a simple polygon to surround the Marshalltown area
polygon = "Polygon ((-92.99085569 42.08026803, -92.98770013 41.98745385, -92.85185308 41.98499102, -92.85059085 42.08331266, -92.99085569 42.08026803))"
geo = gpd.GeoSeries.from_wkt([polygon], crs=4326)
model_area = gpd.GeoDataFrame({"data": [1]}, geometry=geo)
Create the new model supply and open it
rootdir = Path(gettempdir())

Network.create(rootdir / "my_model_supply.sqlite", srid=26916, jumpstart=True)
net = Network.from_file(rootdir / "my_model_supply.sqlite", False)
net.upgrade()
/home/gitlab-runner/builds/polaris/code/polarislib/polaris/network/database/migrations/20241020-standard_area_types.py:24: UserWarning: Area_Type table has been updated. Please run geo-consistency checks to update the network
  warnings.warn("Area_Type table has been updated. Please run geo-consistency checks to update the network")
Attempting to copy County_Skims data from Supply->Freight, but table is empty

<polaris.network.network.Network object at 0x75949fca5eb0>
Creating the zoning system#
Census API keys can be obtained from https://api.census.gov/data/key_signup.html
net.populate.add_zoning_system(model_area, "tracts", os.environ.get("CENSUS_API_KEY"), 2021)
/home/gitlab-runner/builds/polaris/code/polarislib/polaris/prepare/supply_tables/populate_tables.py:48: UserWarning: 626eeb8940359284f8e236fb339a4a7207804a54
  warnings.warn(key)
/venv-py312/lib/python3.12/site-packages/pyogrio/__init__.py:7: DeprecationWarning: The 'shapely.geos' module is deprecated, and will be removed in a future version. All attributes of 'shapely.geos' are available directly from the top-level 'shapely' namespace (since shapely 2.0.0).
  import shapely.geos  # noqa: F401
Using FIPS code '19' for input 'Iowa'
Using FIPS code '19' for input 'Iowa'
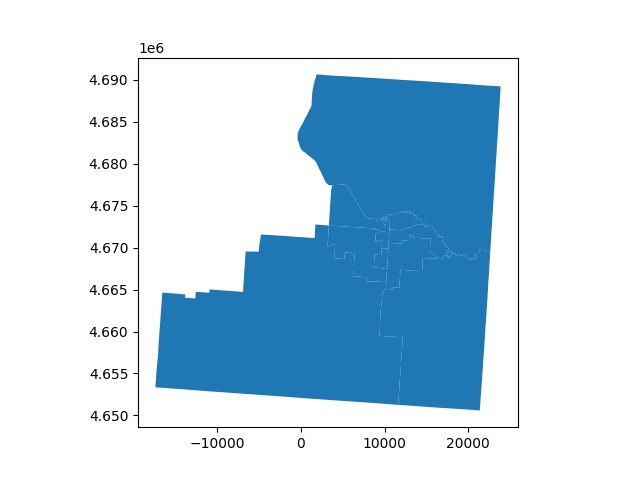
Let’s take a look at what we generated
net.tables.get("Zone").plot()

<Axes: >
Adding EV Chargers#
NREL API keys can be obtained from https://developer.nrel.gov/signup/
We will try to cluster chargers that are within 50m from each other. The algorithm has some randomness, so we will try 5 times
net.populate.add_ev_chargers(os.environ.get("EV_API_KEY"), max_dist=50, clustering_attempts=5)
Using the default year of 2024
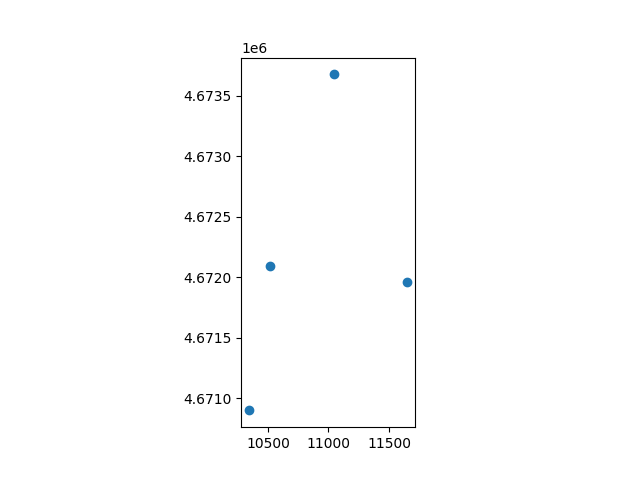
Let’s take a look at what we generated
net.tables.get("EV_Charging_Stations").plot()

<Axes: >
We will add parking facilities from OpenStreetMap The default tags for parking facilities are (“surface”, “underground”, “multi-storey”, “rooftop”) and the sample rate is 100% net.populate.add_parking(facility_types=(“surface”, “underground”, “multi-storey”, “rooftop”), sample_rate=1.0)
net.populate.add_parking()
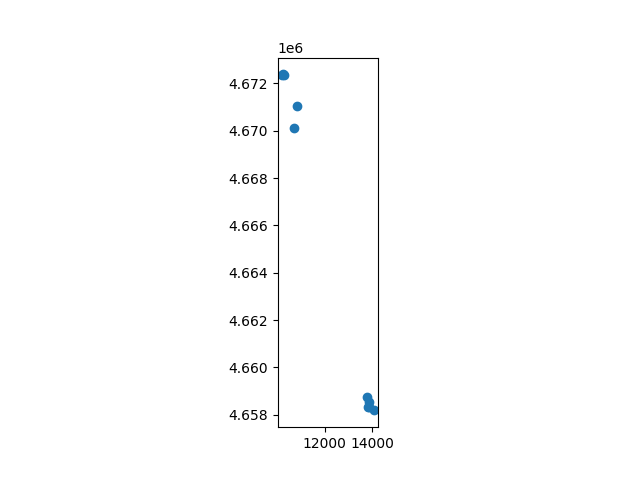
Let’s take a look at what we generated
net.tables.get("Parking").plot()

<Axes: >
Adding Locations#
And don’t forget to add external locations in case you are going to have external travel
Control totals for residential locations come straight from Census (default to latest data available from ACS) We need control totals for non-residential locations, however
# Let's say we have data for that
gjson = """
{
    "type": "FeatureCollection",
    "crs": { "type": "name", "properties": { "name": "urn:ogc:def:crs:OGC:1.3:CRS84" } },
    "features": [
        {
            "type": "Feature",
            "properties": { "BUSINESS": 2.0, "DISTRIBUTION": 5.0, "EDUCATION": 3.0, "HIGHER_EDUCATION": 2.0, "HOTEL": 3.0, "INDUSTRY": 1.0, "MAJ_SHOP": 1.0, "MEDICAL": 1.0, "RETAIL": 2.0 },
            "geometry": { "type": "Polygon", "coordinates":  [ [ [ -92.826439648222348, 41.951002108252993 ], [ -92.819935474384991, 42.09468522120526 ], [ -93.007373938606676, 42.126614801861322 ], [ -92.951792816723909, 41.938585049108966 ], [ -92.826439648222348, 41.951002108252993 ] ] ]}
        }
    ]
}
"""

with open(rootdir / "control_data.geojson", "w") as fl:
    fl.write(gjson)
control_totals = gpd.read_file(rootdir / "control_data.geojson")

net.populate.add_locations(
    control_totals=control_totals,
    census_api_key=os.environ.get("CENSUS_API_KEY"),
    residential_sample_rate=0.25,
    other_sample_rate=1.0,
)
Using FIPS code '19' for input 'Iowa'
Using FIPS code '19' for input 'Iowa'
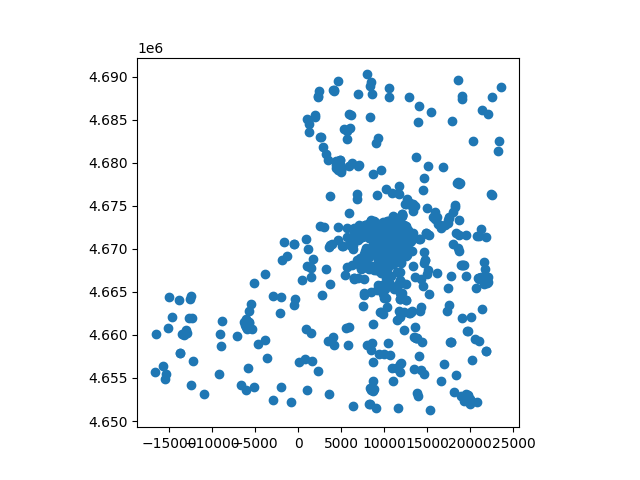
net.tables.get("Location").plot()

<Axes: >
Adding Road Network#
Adding a network from OpenStreetMap requires a large number of parameters to be set. We will use the default values for most of them
WARNING
Link speeds are left in the unit found in the OSM network. you MUST transform them to m/s before running any simulation.
simpli_par = {
    "simplify": True,  # We do want to simplify the network instead of keeping 100% of the OSM links
    "keep_transit_links": True,  # We want to keep all links for which there is at least one transit route
    "accessibility_level": "block-groups",
    # We will simplify the network based on zones. Using "location" would result on a denser network
    "maximum_network_capacity": False,
    # We want to use a more intense path finding algorithm to search for virtually all alternative routes
}
imput_par = {
    "algorithm": "knn",  # "knn" or "iterative"
    # "max_iter": 10, # Maximum number of iterations in the imputation algorithm. Only needed for "iterative" algorithm
    "fields_to_impute": ("speed_ab", "speed_ba", "lanes_ab", "lanes_ba"),
}

net_constructor = net.populate.create_network(simplification_parameters=simpli_par, imputation_parameters=imput_par)
Using FIPS code '19' for input 'Iowa'
There are two steps in simplifying the network
# The first one is to download all relevant GTFS feeds from the mobility database
# It will download the feeds to the project folder inside supply/gtfs
# It will skip all downloads if there are pre-existing GTFS feeds in that path

# You must first obtain a mobility database API key on https://mobilitydatabase.org/sign-up
mobility_database_api_key = os.environ.get("MOBILITY_DATABASE_API_KEY")
feed_count = net_constructor.download_gtfs(api_key=mobility_database_api_key)
print(f"{feed_count} GTFS feeds were found in the mobility database for this area")

# If we had a GTFS feed available for this area we could add it to the model folder before continuing to network build
# dest_path = Path(net.path_to_file).parent / "supply" / "gtfs"
# dest_path.mkdir(parents=True, exist_ok=True)
# shutil.copy(join(SRC_FOLDER, "gtfs_feed.zip"), str(dest_path / "gtfs_feed.zip"))
1 GTFS feeds were found in the mobility database for this area
The second step is to run the network build and import, which will run the simplification process if requested
net_constructor.build_network()

# And then import the transit data from our GTFS feed
# If you don't provide a date of service to be imported, we software will choose the one with the most services running
# for each feed available for import
net_constructor.import_transit(map_match=False, date="")
Total polygons: 1                                 :   0%|          | 0/1 [00:00<?, ?it/s]
Processing chunks                                 :   0%|          | 0/1 [00:00<?, ?it/s]
Adding network links                              : 0it [00:00, ?it/s]
/home/gitlab-runner/builds/polaris/code/polarislib/polaris/prepare/supply_tables/network/parameter_imputation.py:33: UserWarning: Geometry is in a geographic CRS. Results from 'centroid' are likely incorrect. Use 'GeoSeries.to_crs()' to re-project geometries to a projected CRS before this operation.

  gdf_links["centroid"] = gdf_links.geometry.centroid
/home/gitlab-runner/builds/polaris/code/polarislib/polaris/prepare/supply_tables/network/parameter_imputation.py:34: UserWarning: Geometry is in a geographic CRS. Results from 'centroid' are likely incorrect. Use 'GeoSeries.to_crs()' to re-project geometries to a projected CRS before this operation.

  gdf_links["centroid_x"] = gdf_links.centroid.x
/home/gitlab-runner/builds/polaris/code/polarislib/polaris/prepare/supply_tables/network/parameter_imputation.py:35: UserWarning: Geometry is in a geographic CRS. Results from 'centroid' are likely incorrect. Use 'GeoSeries.to_crs()' to re-project geometries to a projected CRS before this operation.

  gdf_links["centroid_y"] = gdf_links.centroid.y
Using FIPS code '19' for input 'Iowa'
Using FIPS code '19' for input 'Iowa'
Using FIPS code '19' for input 'Iowa'
Using FIPS code '19' for input 'Iowa'
Using FIPS code '19' for input 'Iowa'
Using FIPS code '19' for input 'Iowa'
Using FIPS code '19' for input 'Iowa'
walk                                              :   0%|          | 0/52 [00:00<?, ?it/s]
Equilibrium Assignment                            :   0%|          | 0/2 [00:00<?, ?it/s]
Using FIPS code '19' for input 'Iowa'
Using FIPS code '19' for input 'Iowa'
Using FIPS code '19' for input 'Iowa'
Using FIPS code '19' for input 'Iowa'
Using FIPS code '19' for input 'Iowa'
Using FIPS code '19' for input 'Iowa'
Using FIPS code '19' for input 'Iowa'
car_usage                                         :   0%|          | 0/52 [00:00<?, ?it/s]
Equilibrium Assignment                            :   0%|          | 0/50 [00:00<?, ?it/s]
Loading routes (Step: 1/12)                       : 0it [00:00, ?it/s]
Loading stops (Step: 2/12)                        :   0%|          | 0/525 [00:00<?, ?it/s]
Loading stop times (Step: 3/12)                   :   0%|          | 0/49 [00:00<?, ?it/s]
Loading shapes (Step: 4/12)                       :   0%|          | 0/12 [00:00<?, ?it/s]
Loading trips (Step: 5/12)                        :   0%|          | 0/49 [00:00<?, ?it/s]
De-conflicting stop times (Step: 6/12)            :   0%|          | 0/11 [00:00<?, ?it/s]
Loading data for 2025-07-14 (Step: 9/12) -        :   0%|          | 0/8 [00:00<?, ?it/s]
Map-matching patterns                             :   0%|          | 0/9 [00:00<?, ?it/s]
Building graphs - Indexing links (Step: 8/12)     : 0it [00:00, ?it/s]
Building graphs - Breaking links (Step: 8/12)     :   0%|          | 0/525 [00:00<?, ?it/s]
Saving patterns (Step: 10/12)                     :   0%|          | 0/9 [00:00<?, ?it/s]
Saving trips (Step: 11/12)                        :   0%|          | 0/46 [00:00<?, ?it/s]
Saving links (Step: 11/12)                        :   0%|          | 0/621 [00:00<?, ?it/s]
Saving stops (Step: 12/12)                        :   0%|          | 0/385 [00:00<?, ?it/s]
/home/gitlab-runner/builds/polaris/code/polarislib/polaris/prepare/supply_tables/network/net_constructor.py:82: UserWarning: Speed units are those found in the OSM network. Please transform them to m/s.
  warnings.warn("Speed units are those found in the OSM network. Please transform them to m/s.")
If you are not very familiar with all the components of the network and how they articulate with each other, you can simply run this method to enforce consistency throughout the network and make sure all pieces that can be run automatically will be run. THERE IS NO REASON TO RUN THIS OVER AND OVER AGAIN. If you find yourself doing so, please revisit the documentation
net.full_rebuild()
/home/gitlab-runner/builds/polaris/code/polarislib/polaris/network/consistency/geo_consistency.py:520: FutureWarning: Downcasting object dtype arrays on .fillna, .ffill, .bfill is deprecated and will change in a future version. Call result.infer_objects(copy=False) instead. To opt-in to the future behavior, set `pd.set_option('future.no_silent_downcasting', True)`
crit2 = df.offset.fillna(value=0.0).round(2) != df.nffst.fillna(value=0.0).round(2)
/home/gitlab-runner/builds/polaris/code/polarislib/polaris/network/consistency/geo_consistency.py:521: FutureWarning: Downcasting object dtype arrays on .fillna, .ffill, .bfill is deprecated and will change in a future version. Call result.infer_objects(copy=False) instead. To opt-in to the future behavior, set `pd.set_option('future.no_silent_downcasting', True)`
crit3 = df.setback.fillna(value=0.0).round(2) != df.nstbck.fillna(value=0.0).round(2)
/venv-py312/lib/python3.12/site-packages/geopandas/tools/overlay.py:358: UserWarning: `keep_geom_type=True` in overlay resulted in 8 dropped geometries of different geometry types than df1 has. Set `keep_geom_type=False` to retain all geometries
result = _collection_extract(result, geom_type, keep_geom_type_warning)
Closes project#
print("REFERENCE: You can keep navigating the map after closing the project")
net.close(False)
REFERENCE: You can keep navigating the map after closing the project
Total running time of the script: (5 minutes 53.983 seconds)