Note
Go to the end to download the full example code.
Creating School Locations from Enrolment Data#
In this example, we show how to use Polaris-Studio to create school locations with appropriate enrolments data for the modelling area.
Imports#
sphinx_gallery_thumbnail_path = ‘../../examples/model_building/import_enrolments.png’
%load_ext autoreload %autoreload 2
from pathlib import Path

import pandas as pd
import geopandas as gpd
import matplotlib.pyplot as plt
import contextily as ctx

from polaris import Polaris
from polaris.utils.testing.temp_model import TempModel
from polaris.utils.plot_utils import get_marker_sizes
⚠️ Friendly exception handler is disabled via FRIENDLY_ERRORS_DISABLED
We need to provide some good enrolment data to the process. The following snippet was build by collection of data from various public sources
from polaris.utils.file_utils import get_caller_directory

enrolments_file = get_caller_directory() / "education_locations_bloomington.parquet"

gpd.read_parquet(enrolments_file).head()
gpd.read_parquet(enrolments_file).school_type.value_counts()
school_type
num_k_8     30
num_prek    11
num_9_12    10
tertiary     6
Name: count, dtype: int64
Now lets actually pass that data into the school location importer
model = Polaris(TempModel("Bloomington"))
model.network.populate.add_school_locations(enrolments_file)
2026-07-10 08:25:18 UTC+0000 - Working with file on /tmp/polaris_studio_testing/2026-07-10_08-25-16--889be48dec62/Bloomington-Supply.sqlite
2026-07-10 08:25:18 UTC+0000 - Adding school locations from /home/gitlab-runner/builds/polaris/code/polarislib/docs/examples/model_building/education_locations_bloomington.parquet
2026-07-10 08:25:18 UTC+0000 - Creating file at /root/.config/polaris/open_data_cache.sqlite
2026-07-10 08:25:25 UTC+0000 - Downloading places from Overture maps. Sit tight! This may take a while.
2026-07-10 08:25:33 UTC+0000 - places data downloaded. Basic geo-processing
2026-07-10 08:25:33 UTC+0000 - Found 32 childcare centres from Overture maps POI, adding these with an average enrolment of 105.0 students
2026-07-10 08:25:33 UTC+0000 - 89 out of 89 nation-wide education locations are in model area
2026-07-10 08:25:34 UTC+0000 - Inserting 89 new education locations
2026-07-10 08:25:34 UTC+0000 - Inserting enrolment data for 89 school locations
2026-07-10 08:25:34 UTC+0000 - Running consistency checks on the supply database
2026-07-10 08:25:34 UTC+0000 - Updating Location geo-association throughout the database
2026-07-10 08:25:34 UTC+0000 -   location geo association for Ev_charging_Stations
2026-07-10 08:25:34 UTC+0000 - Updating Link geo-association throughout the database
2026-07-10 08:25:35 UTC+0000 -    link records corrected for 2 records on Location
2026-07-10 08:25:35 UTC+0000 -    link records corrected for 3948 records on Parking
2026-07-10 08:25:36 UTC+0000 -    bike_link records corrected for 3 records on Location
2026-07-10 08:25:36 UTC+0000 -    walk_link records corrected for 3 records on Location
2026-07-10 08:25:36 UTC+0000 -    bike_link records corrected for 65 records on Parking
2026-07-10 08:25:36 UTC+0000 -    walk_link records corrected for 64 records on Parking
2026-07-10 08:25:36 UTC+0000 - Searching for location link candidates
2026-07-10 08:25:37 UTC+0000 -       Rebuilding Location Links
2026-07-10 08:25:38 UTC+0000 -       Saving Location Links
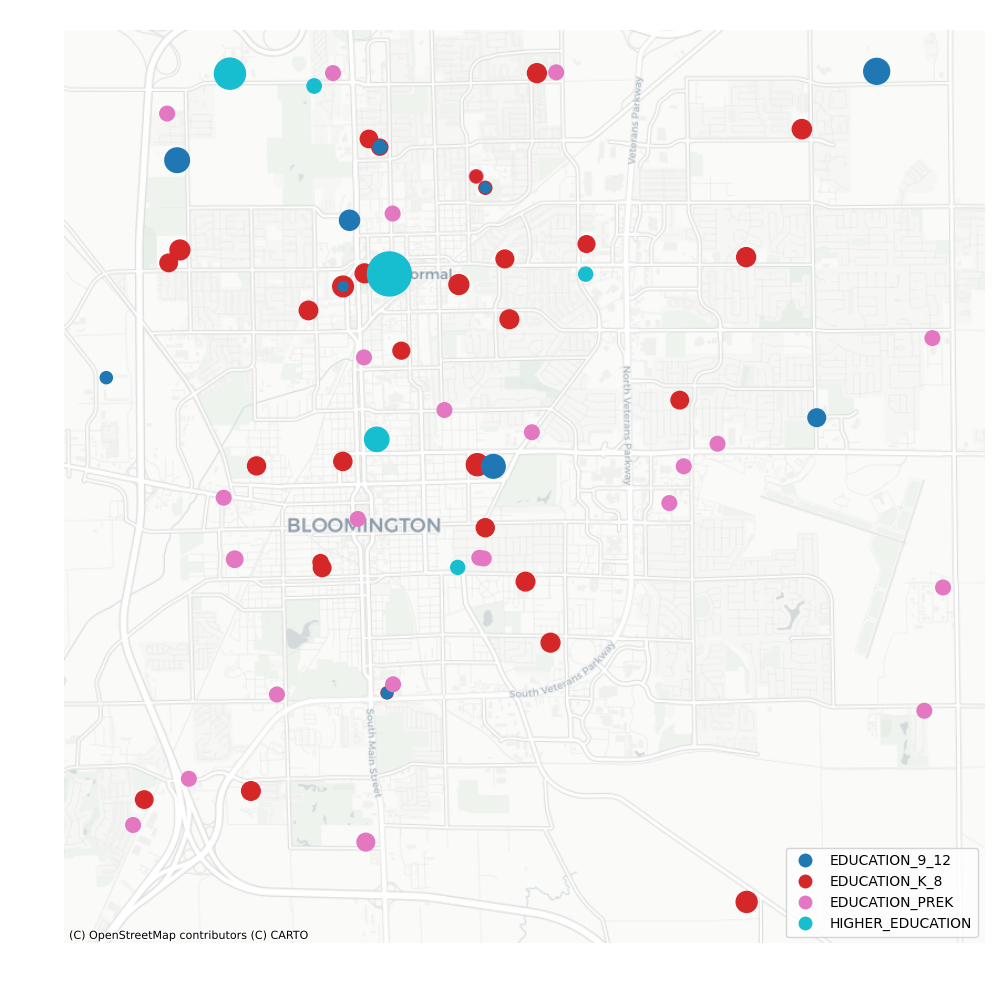
# Lets look at the results
df_loc = model.network.tables.get("location")
df_loc = df_loc.merge(model.network.tables.get("location_attributes")[["location", "enrolments"]], on="location")
print(df_loc.groupby("land_use").agg({"enrolments": ["count", "sum"]}).round(0))
df_loc = df_loc[df_loc.land_use.str.contains("EDUCATION")].to_crs(epsg=3857)  # Web Mercator for contextily basemap

markers = get_marker_sizes(df_loc, "enrolments", min_size=50, max_size=1000)
ax = df_loc.plot(column="land_use", categorical=True, legend=True, figsize=(10, 10), markersize=markers, alpha=1.0)
ctx.add_basemap(ax, source=ctx.providers.CartoDB.Positron)

plt.tight_layout()
ax.set_axis_off()
plt.show()
                   enrolments
                        count       sum
land_use
AGRICULTURE                19       0.0
BUSINESS                 1034       0.0
CIVIC                     514       0.0
CULTURE                    96       0.0
DISTRIBUTION                9       0.0
EDUCATION_9_12            136   74572.0
EDUCATION_K_8             414  138194.0
EDUCATION_PREK            424   29015.0
HIGHER_EDUCATION          190  331296.0
HOTEL                     106       0.0
INDUSTRY                   43       0.0
MANUFACTURING              46       0.0
MEDICAL                   865       0.0
RECREATION                408       0.0
RESIDENTIAL-MULTI         122       0.0
RESIDENTIAL-SINGLE       1209       0.0
RESTAURANT                631       0.0
RETAIL                    903       0.0
SERVICES                 1495       0.0
SPECIAL_GEN                48       0.0
Total running time of the script: (0 minutes 27.932 seconds)