Note
Go to the end to download the full example code.
Analyze a trip table#
This example shows how to: - Analyze a trip table after it has been generated by Polaris - Analyze a trip table from file (exogenous trips)
Imports
from pathlib import Path

import pandas as pd

from polaris import Polaris
from polaris.analyze.demand_report import demand_report
from polaris.utils.database.data_table_access import DataTableAccess
model_dir = Path("/tmp/Austin")
supply_file = Polaris.from_dir(model_dir).supply_file
demand_file = Polaris.from_dir(model_dir).demand_file
Read Locations table from the Supply database
dta = DataTableAccess(supply_file)
locations = dta.get("Location")
Read trip table from the Exogenous file
trips = pd.read_csv(model_dir / "demand/trip.zip")

# Reading from the demand database is also easy:
# dta_demand = DataTableAccess(demand_file)
# trips = dta_demand.get("Trip")
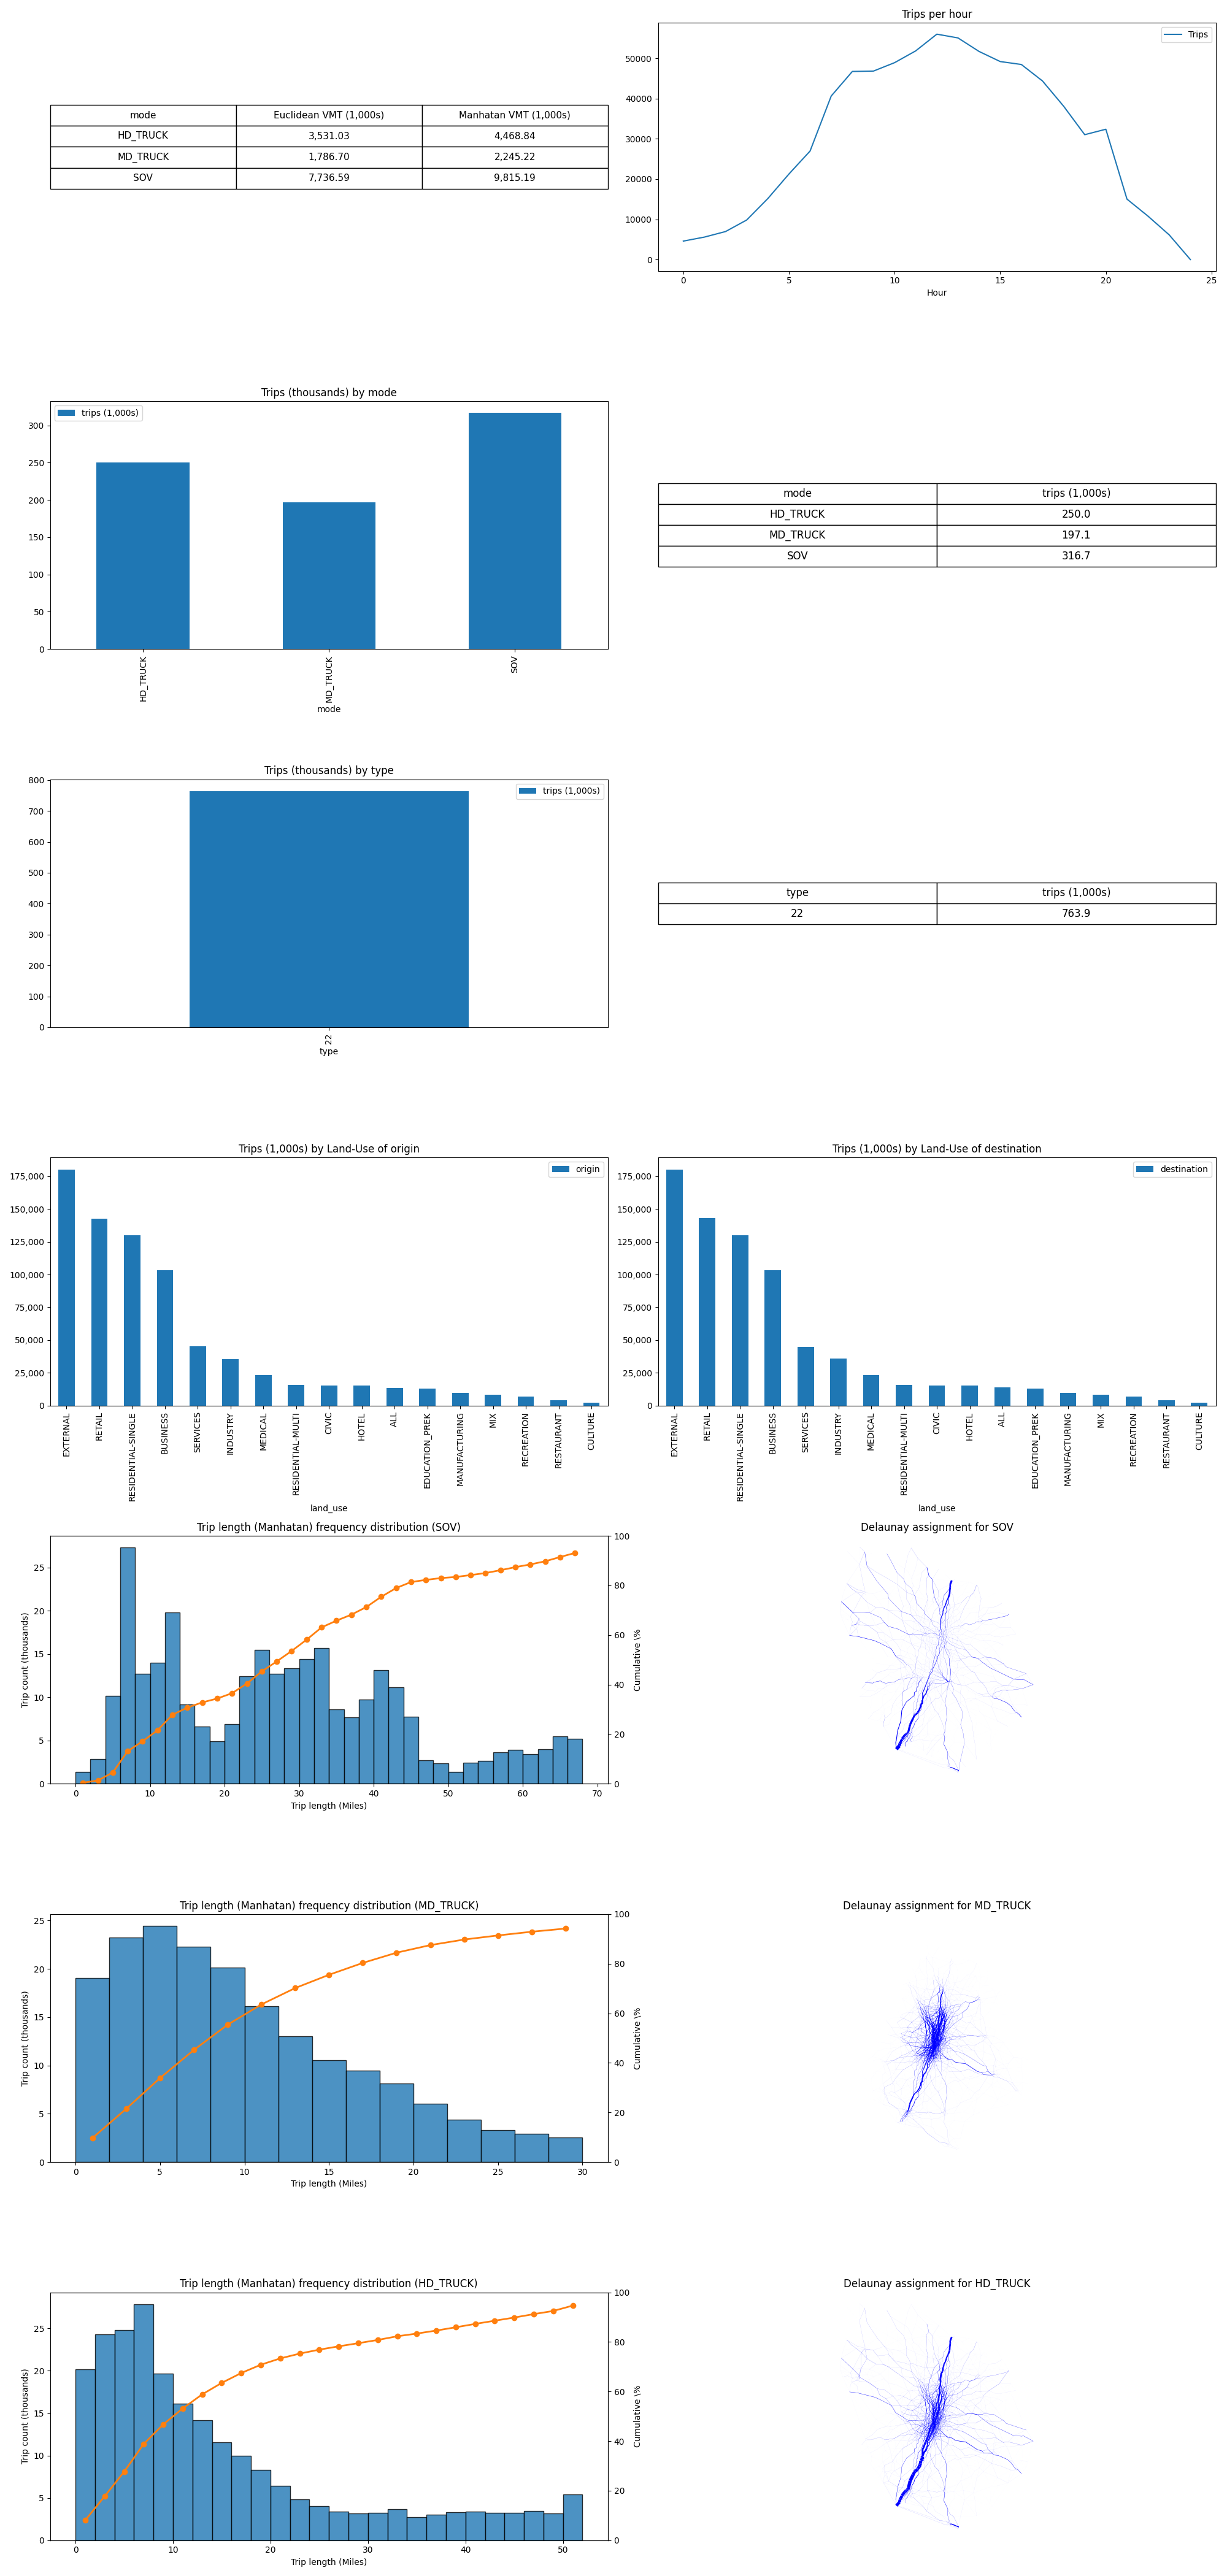
Now we can run the demand report analysis on the trip table
report = demand_report(trips=trips, locations=locations)
delaunay                                          :   0%|          | 0/2102 [00:00<?, ?it/s]
Equilibrium Assignment                            :   0%|          | 0/250 [00:00<?, ?it/s]
We can save the report to disk if we want
report.savefig(model_dir / "report_demand.png", dpi=600)
Total running time of the script: (0 minutes 31.336 seconds)