Memory Usage#
If you set the MEMORY_LOGGING preprocessor definition, then the simulation event loop will write out a running tally of how many objects of each type are currently allocated and how much memory they are consuming. This will be written to a csv file in the output directory at the start of each hour period within the simulation.
The syntax of csv file is Typeid,Typename,Iteration,KBytes
Typeid,Typename,Iteration,KBytes
0,"Activity_Components::Implementations::ADAPTS_Activity_Plan_Implementation<MasterType, polaris::TypeList<polaris::NULLTYPE, polaris::NULLTYPE>, void>",3600,16375.8
1,"Activity_Components::Implementations::ADAPTS_Routine_Activity_Plan_Implementation<MasterType, polaris::TypeList<polaris::NULLTYPE, polaris::NULLTYPE>, void>",3600,2596.78
2,"Activity_Components::Implementations::ADAPTS_At_Home_Activity_Plan_Implementation<MasterType, polaris::TypeList<polaris::NULLTYPE, polaris::NULLTYPE>, void>",3600,12027.5
3,"Routing_Components::Implementations::Routing_Implementation<MasterType, polaris::TypeList<polaris::NULLTYPE, polaris::NULLTYPE>, void>",3600,1307.69
This can be enabled from the command line (CLI) build scripts by adding “memory_logging” to your enable_libs:
python build.py -c -b -e "memory_logging"
or adding it in your build-config.json:
───────┬────────────────────────────────────────────────────────
       │ File: build-config.json
───────┼────────────────────────────────────────────────────────
   1   │ {
   2   │     "linux": {
   3   │         "deps_dir": "/opt/polaris/deps",
   .   |         ...
  11   │         "enable_libs": [
  12   │             "cplex",
  13   │             "memory_logging"
  14   │         ],
  ..   |         ...
  20   │         "working_dir": "/home/jamie/git/polaris-linux"
  21   │     }
  22   │ }
───────┴────────────────────────────────────────────────────────
Analyzing memory usage#
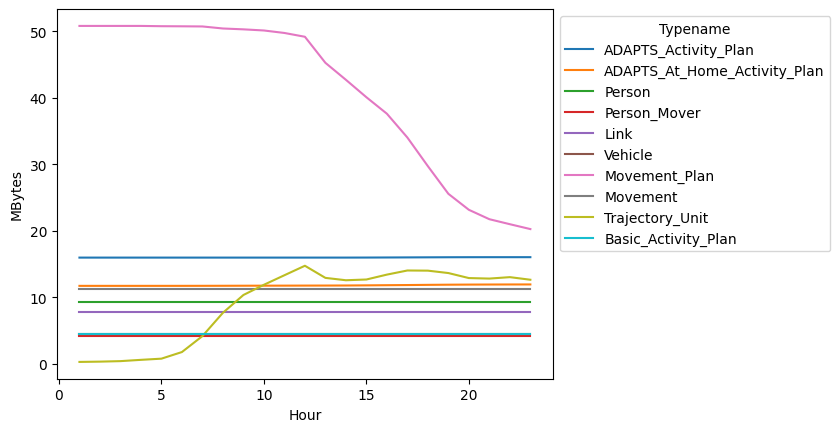
The easiest way to get started looking at the resulting memory log is to use the example notebook examining_memory_usage.py in the polaris-studio documentation.
An example of the output of that notebook when examining the Grid model is given below for the 10 object types with the highest peak memory use (plotted over the entire simulation period).
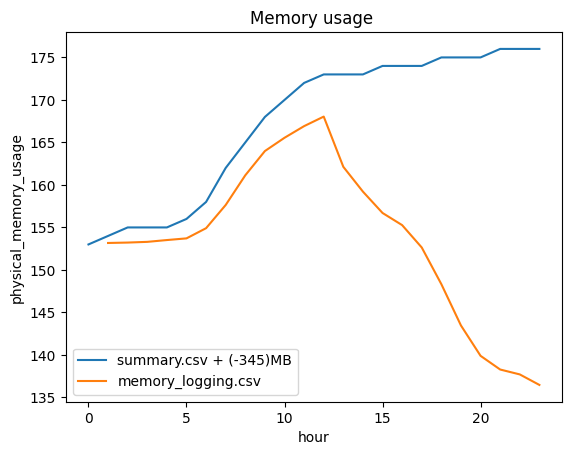
This analysis doesn’t tell the whole story though as it doesn’t account for any dynamically allocated memory (i.e. via a vector.resize() or .push_back()). From the summary file we can get a reading of what the operating system thought our total memory footprint was and this can show the same trends but exposes the inability to reliably release memory back to the OS.
When running on Grid - we see about a 345MB delta over and above the 150MB of memory that is tracked via memory_logging.csv and we also see that the memory footprint continues to go up even as the space occupied by allocated objects goes down.