3D Visualizer#
The POLARIS simulator has a built-in 3D visualizer, named ANTARES, compatible with Windows only. This visualizer can be used during a simulation run or using output files from a previous run. The ANTARES visualizer is a work-in-progress and therefore may it may be unstable, features may not work as intended, and large changes may occur that outpace this document. Issues can be reported and tracked on the public GitLab issues board.
POLARIS has to be reconfigured and built with specific commands to enable ANTARES, as shown below:
python build.py -cb -e antares
The dependencies for antares are included in the standard package of dependencies; you can confirm this by looking for the “antares” folder with the dependencies. When POLARIS is configured to run with ANTARES, the solution name will change to “antares.sln”, and the primary executable will become “Integrated_Model_Antares.exe” alongside another new executable “Output_Visualizer.exe”
Integrated Model ANTARES#
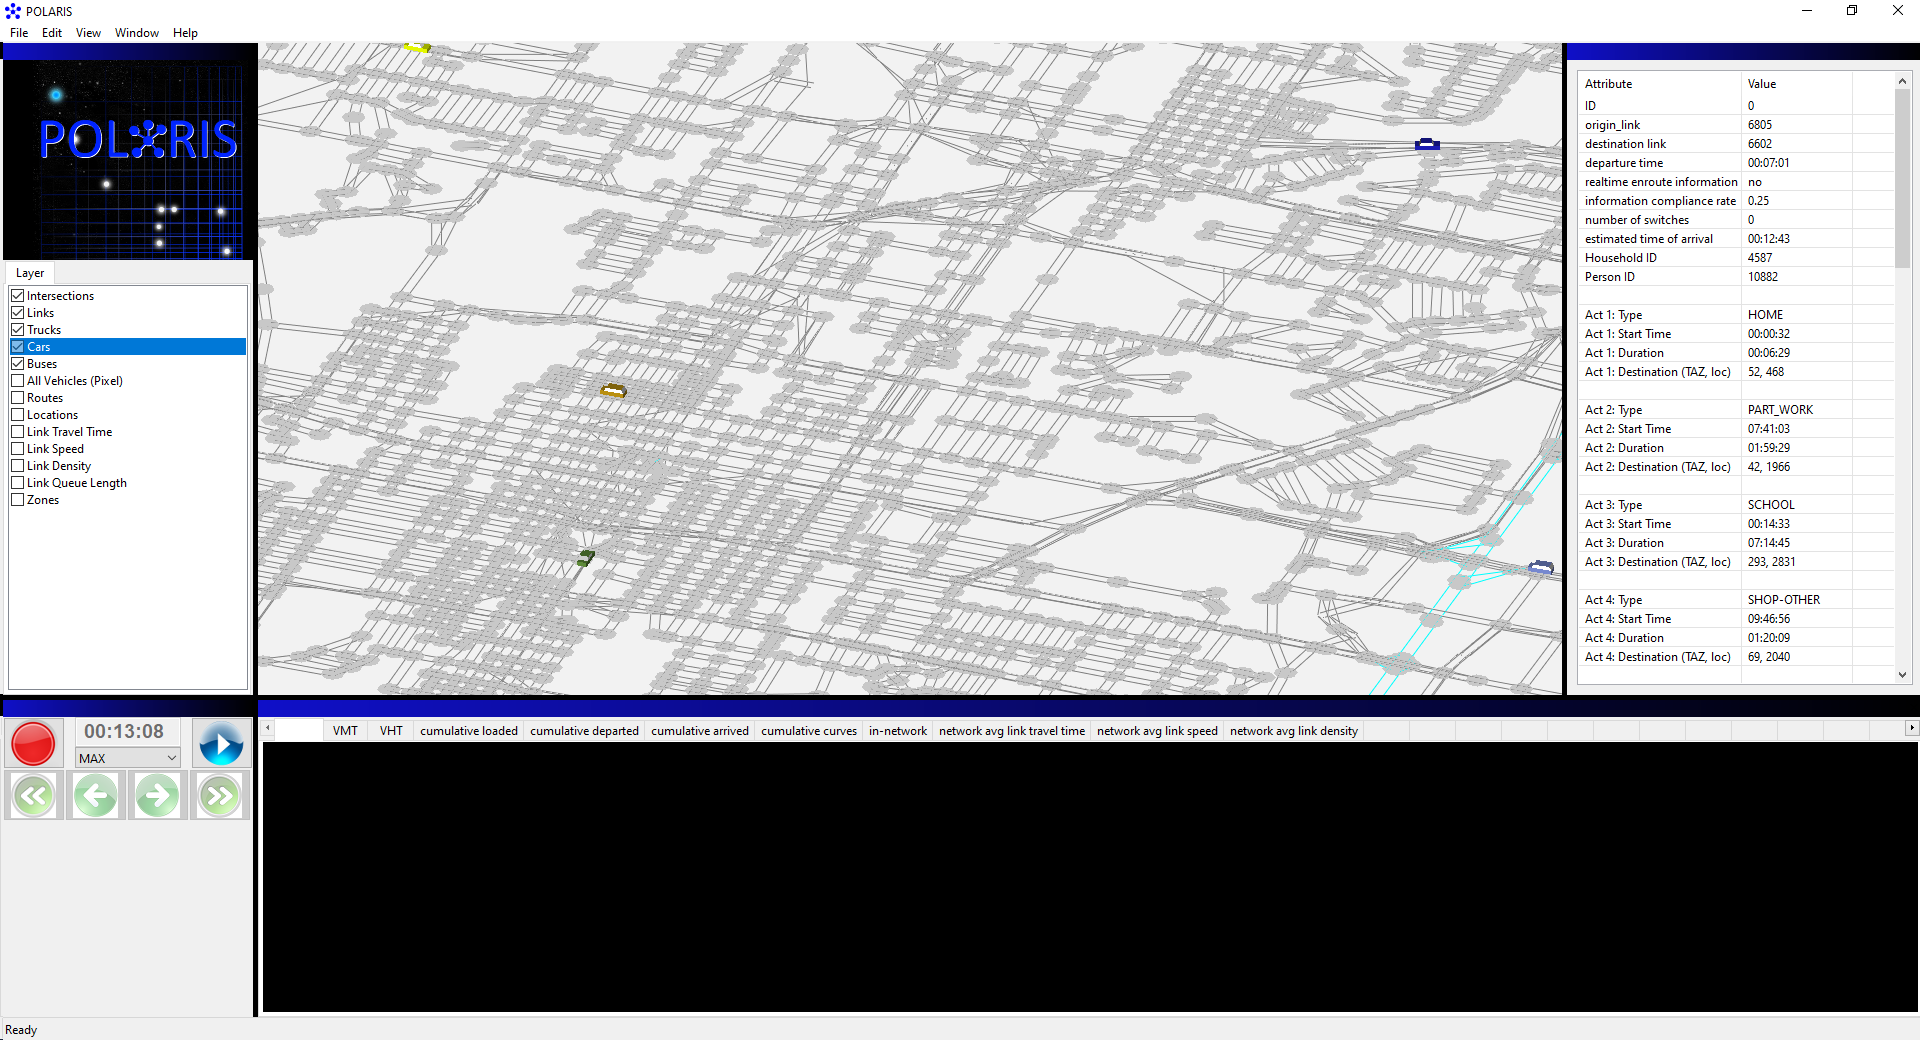
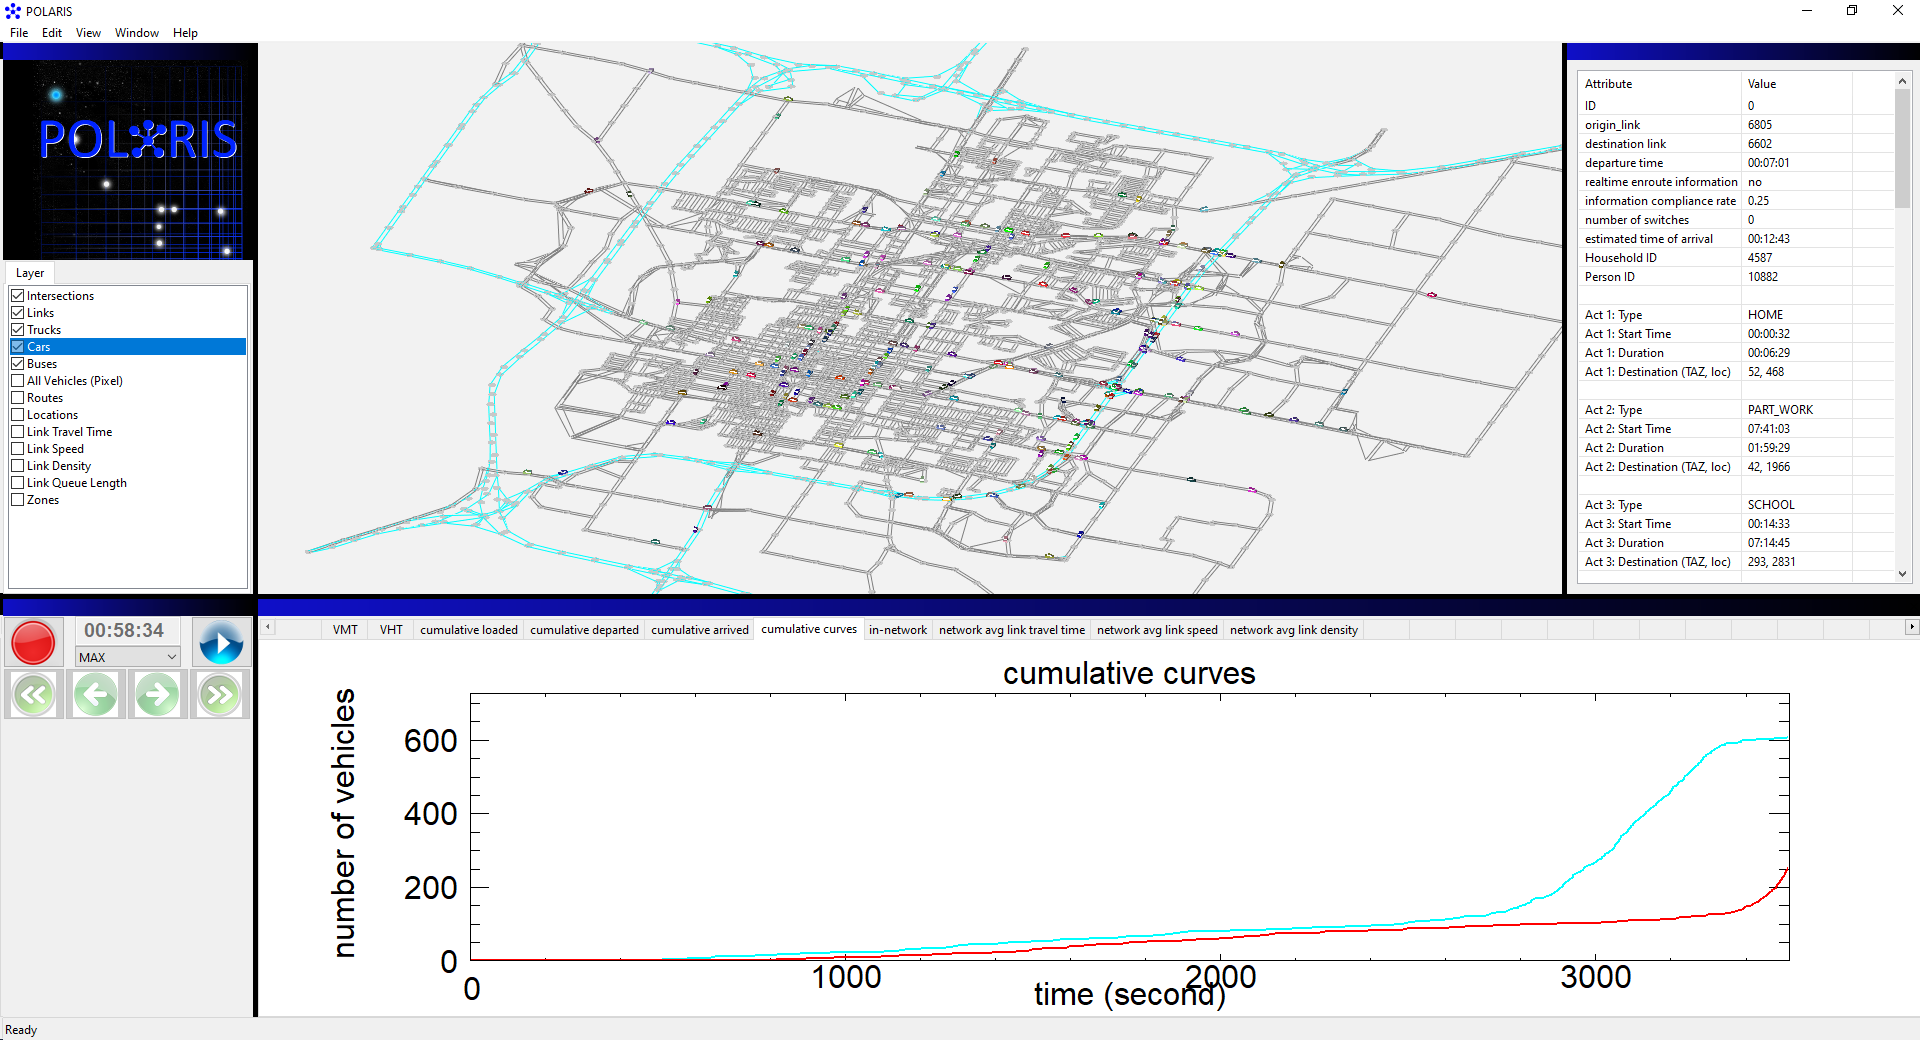
With the new version of Integrated Model, a window will be launched when the POLARIS simulation is initialized and starts running. This is the ANTARES 3D visualizer, which has a few components in panes on the window:
The central 3D canvas. This displays the network, vehicles, and other layers that can be toggled.
The left side has the layer selector, where layers of items on the 3D canvas can be toggled. This is also where you can select a layer before clicking on an item in the 3D canvas for more information
The right side a table for object information; after selecting an object on the canvas (such as a vehicle) information about it will be shown here.
The bottom left has time controls. For the Integrated Model simulation, only start and pause are used
The bottom pane has an array of data plots that can be switched between
3D Canvas#

The primary feature of the 3D Visualizer, the 3D Canvas primarily displays Vehicles and Network features like Links and Intersections, but can also show related features like planned routes and start/destination locations. Since it is a fully 3D visualization, the camera can be moved around at will with the following controls:
Mouse wheel up/down zooms the camera
Holding down the left mouse button will allow you to use mouse controls to pan, sliding the camera left, right, up and down.
Holding down the right mouse button will allow you to rotate the camera around using mouse controls
When a layer is selected/highlighted in the Layer Selector pane, you can left click on elements in that layer (Cars in the Car layer, etc.) to bring up their information in the Object Information pane.
Layer Selector#
The Layer Selector shows a list of named layers, which have two features:
A toggle button, which will make the layer visible or not
Selecting (highlighting) the layer will allow you to select (click on) objects of that layer type in the 3D canvas, bringing up their information in the Object Information pane.
Object Information#
This pane fills out information on an object selected with a single-click in the 3D Visualizer, from a layer selected in Layer Selector. The information is object-specific and so varies heavily; this pane has no interactivity on its own besides a scroll function if the information is lengthy enough to require it.
Double-click Control Box#
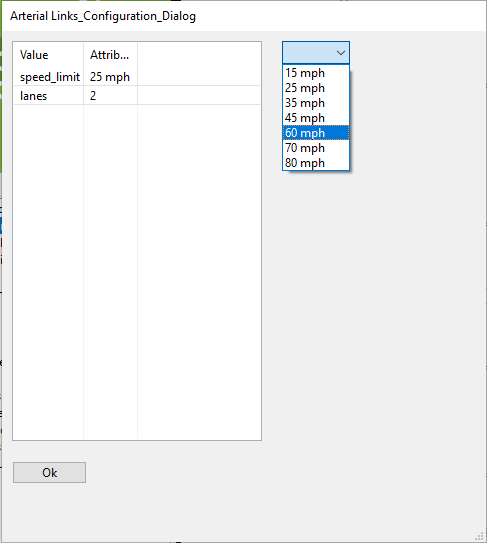
Once a layer is selected, you have the option of double clicking an object to open a control box. Currently this is only supported for links, but this control box will let you change values on the object during runtime. For example, links can have their speed limit and number of lanes changed mid-simulation, changing the behavior of vehicles trying to route through the network.

Time Controls#
The Time control panel has several buttons that can be used to control the simulation runtime:
Play/Pause button starts and stops the simulation
Speed dropdown menu changes the playback speed - MAX is automatic and recommended for simulations, but can be slowed down in the simulation or during playback of output.
Forward and Back arrows - these allow the user to skip forward and backward in time when using the Output Visualizer. These are not enabled in regular simulation runtime.
Recording button - currently disabled, planned feature will allow the user to make a video recording of the ANTARES window.
Data Plots#

The following data is currently applied to data plots within the lower center/right pane:
Vehicle Miles Traveled
Vehicle Hours Traveled
Cumulative Loaded
Cumulative Departed
Cumulative Arrived
Cumulative Curves
In-Network
Network Average Link Travel Time
Network Average Link Speed
Network Average Link Density
Note that these plots are currently in development and may have issues updating during the simulation.
Output Visualizer#
The Output Visualizer is essentially a replay feature, using output from a previous POLARIS run and visualizing it. This requires the standard output of a POLARIS run as well as two special files, “snapshot.bin” and “snapshot.idx” that give information on what vehicles to draw at each frame (“snapshot”) of the simulation. The Output Visualizer is not yet fully realized - it only displays the vehicle movements on the network, it does not contain object information or dataplots. However, time controls are much more refined; the Output Visualizer can change its playback speed in addition for pausing and unpausing.
The Output Visualizer requires input and output from a previous POLARIS runs; so, assuming you have data model folder containing a subfolder with results from POLARIS, you would run the Output_Visualizer.exe in the data model folder, pointing to the scenario and snapshot in the results folder. For example:
./bin/Output_Visualizer.exe Austin_Results/model_files/scenario.json Austin_Results/snapshot.bin