Trajectory Sampling#
The paths generated by agents within POLARIS can be saved out to the Result.h5 for later analysis (see polaris-studio H5Results class). The number of agents whose paths are written out to this file is controlled by the trajectory_sample_rate parameter, increasing this rate will increase the runtime, memory and storage requirements of the model, but not likely to the extent expected.
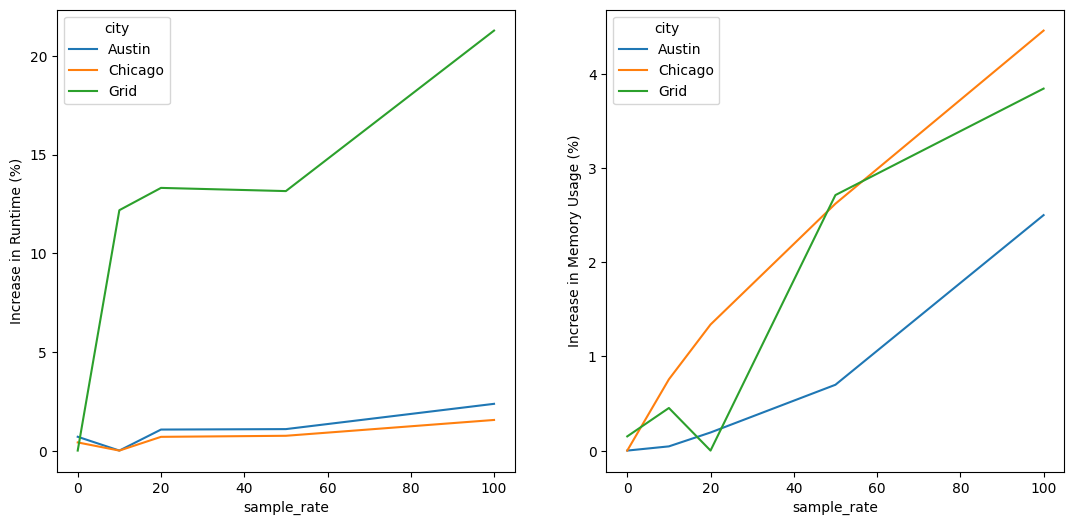
For example, in the following python code, we examine a group of runs where the trajectory sampling rate was varied from 0% to 100%.
df = k._get_results("summary", df_transform=add_cols)
df.loc[:, "runtime"] = df["wallclock_time(ms)"] / 1000
df.loc[:, "physical_memory_usage"] = df["physical_memory_usage"] / 1024

fig, axes = plt.subplots(1, 2, figsize=(13,6))
df_ = df.groupby(['city', 'sample_rate'])[['runtime', 'physical_memory_usage']].max().reset_index()
df_['runtime'] = df_.groupby('city')['runtime'].transform(lambda x: 100 * ((x / x.min()) - 1.0))
df_['physical_memory_usage'] = df_.groupby('city')['physical_memory_usage'].transform(lambda x: 100 * ((x / x.min()) - 1.0))


sns.lineplot(df_, x='sample_rate', y='runtime', hue='city', ax=axes[0])
axes[0].set_ylabel("Increase in Runtime (%)")
sns.lineplot(df_, hue='city', x='sample_rate', y='physical_memory_usage', ax=axes[1])
axes[1].set_ylabel("Increase in Memory Usage (%)")
As can be seen, for larger models the effect of sampling rate is quite minor with full sampling only increasing runtime by 2% and memory usage by 4%.
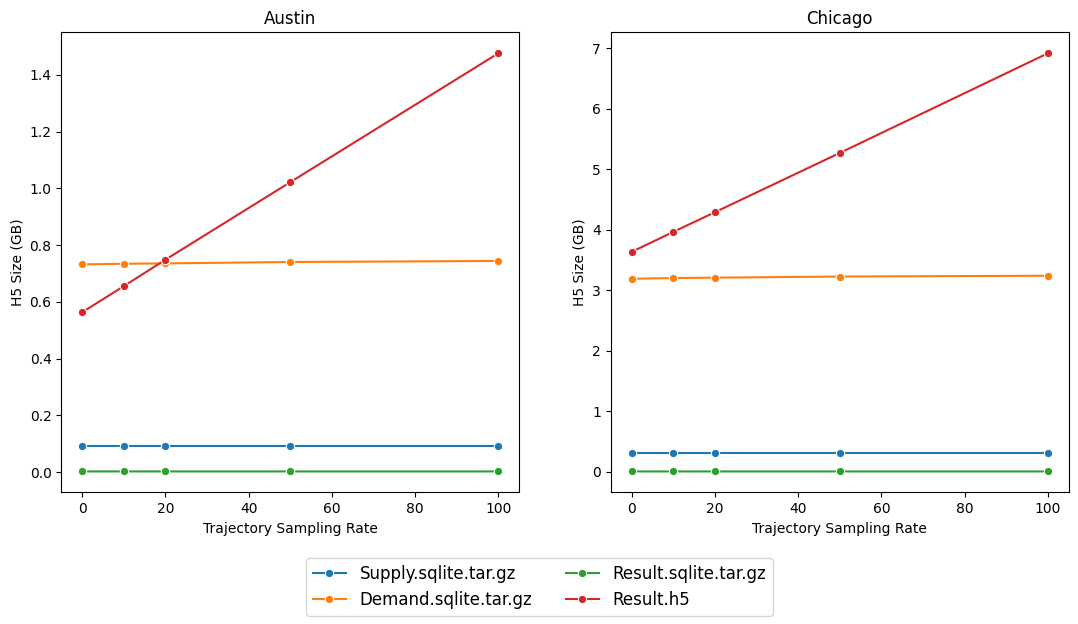
The main effect, however, is on the resulting file size of the output data. Fortunately, POLARIS uses a compressed on-disk format for paths and even 100% results in quite managable filesizes.
from polaris.utils.plot_utils import extract_common_legend

df = k._get_results("file_sizes", df_transform=add_cols)
df['filename'] = df.filename.str.split('-').str[-1]

fig, axes = plt.subplots(1, 2, figsize=(13,6))
def p(city, ax):
    sns.lineplot(df[df.city==city], x='sample_rate', y='filesize', hue='filename', marker='o', ax=ax)
    ax.set_xlabel('Trajectory Sampling Rate')
    ax.set_ylabel('H5 Size (GB)')
    ax.set_title(city)

p('Austin', axes[0])
p('Chicago', axes[1])
extract_common_legend(axes, ncol=2)
As expected, there is a highly linear relationship with increasing trajectory size, however even 100% sample generates filesizes with the same order of magnitude as a 0% sample. The main driver of filesize in a 0% sample is the link and turn MOE data which is also stored in the Results.h5 file.